


A dashboard is a visual display of data, metrics or performance indicators. It gives users a quick overview of important information in one place.
Dashboard
A dashboard is a visual overview of key data, metrics or performance indicators in one place.
Quick facts about dashboards

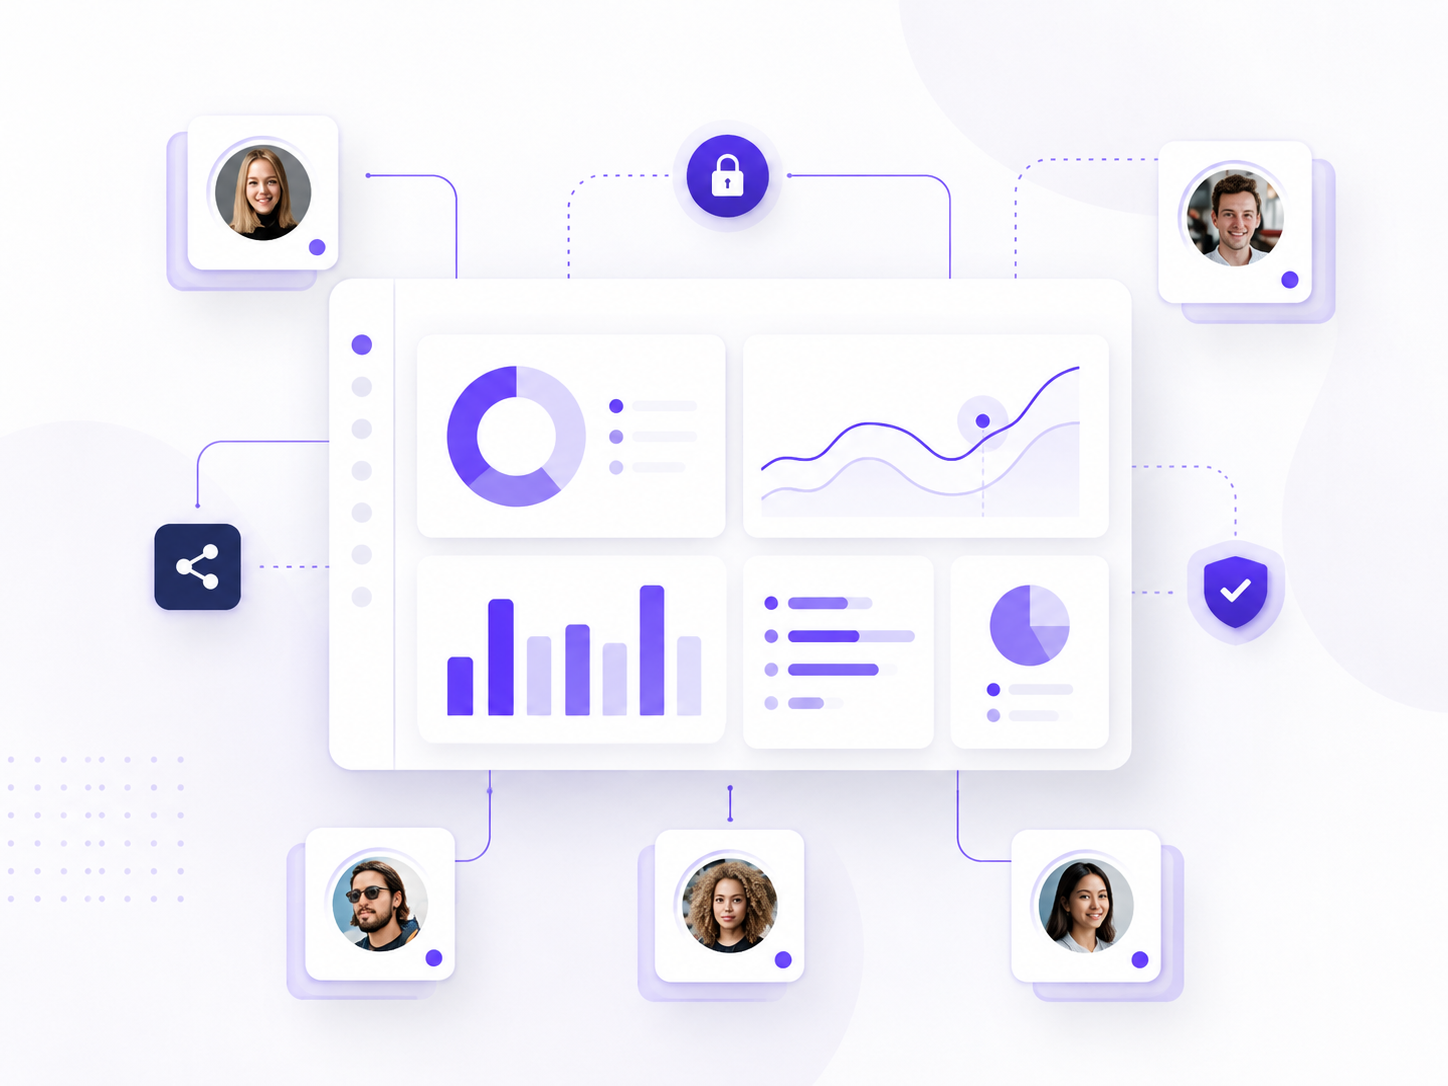
Visual overview
A dashboard presents important data through charts, tables, cards and other visual elements that are easy to scan.

Performance tracking
Dashboards help teams monitor business performance, trends and key metrics over time.

Interactive views
Many dashboards let users filter, explore or drill into data to understand what is driving the numbers.

Shared insight
Dashboards are often used to give teams, leaders or customers a common view of important information.
How dashboards work
Dashboards bring selected data points together into one visual view. They are often used to monitor progress, compare results and make performance easier to understand without opening several reports or spreadsheets. A useful dashboard usually includes:
- Key metrics or KPIs
- Visual charts and tables
- Filters or interactive controls
- A clear audience and purpose
A dashboard is strongest when it is built for a specific decision or audience. A leadership dashboard may focus on high level performance, while an operations dashboard may focus on daily activity, capacity or service levels.
Why dashboard sharing matters
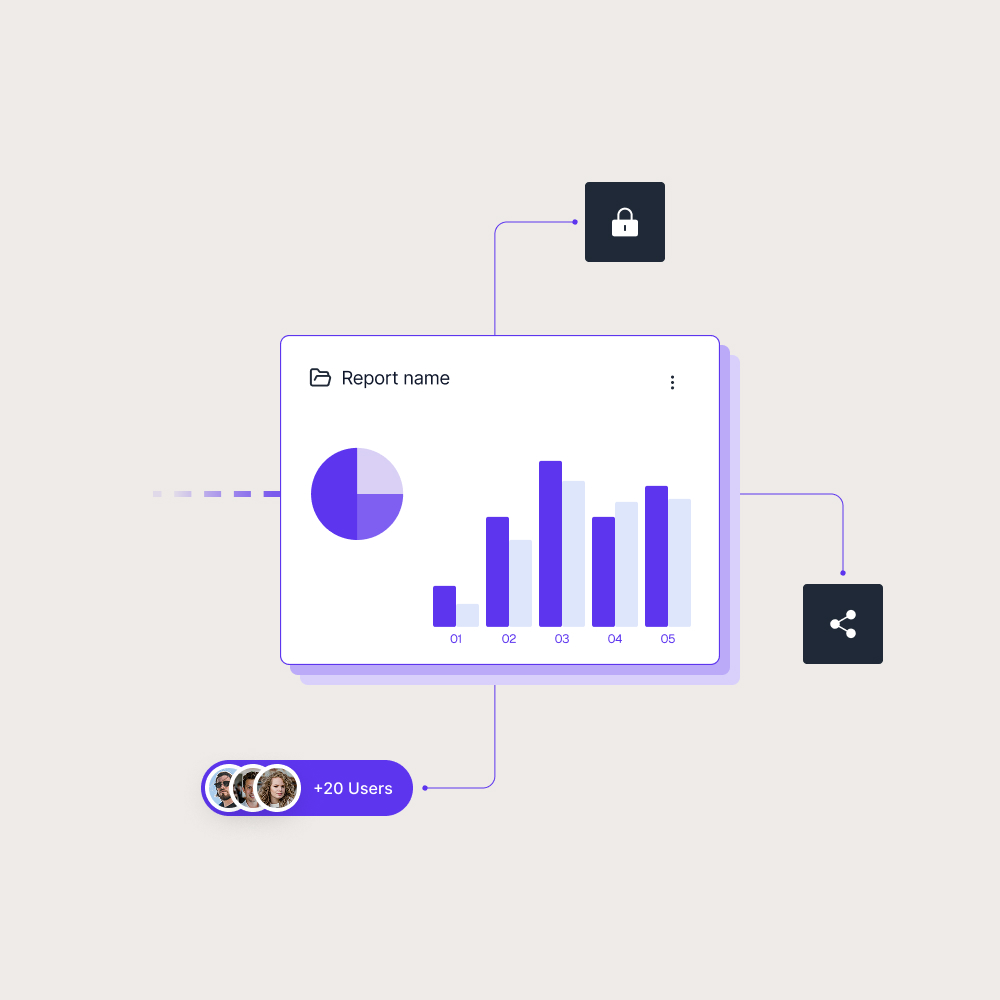
Creating a dashboard is only part of the work. As more people need access, teams also need to think about how the dashboard is shared, who can view it and whether different audiences should see different data.
This becomes more important when dashboards are used outside a small internal team. A leadership team may need a high level view, a customer may need access to selected performance data, and a partner may only need a specific set of dashboards. Without a clear sharing setup, dashboard access can become hard to manage as more users and audiences are added.
Skald BI helps teams share existing Power BI dashboards and reports through a secure branded portal. Instead of sending users into a generic reporting experience, organizations can give customers, partners and internal teams a clearer way to access the dashboards meant for them.
Use cases
See how different types of organisations use Skald BI to share Power BI securely with employees, customers and partners.
Contact us
Try Skald BI for free
Whether you’re looking for expert advice, tailored
solutions, or have a specific inquiry, reach out to
our team.
No set up. Live fast.
Support contact
Follow us
Frequently asked questions
Dashboards are used to monitor performance, track KPIs, compare trends and help teams understand business data more quickly.
What is the difference between a dashboard and a report?
A dashboard usually gives a high level overview of important metrics. A report often provides more detail, deeper analysis and more ways to explore the underlying data.
Can dashboards be interactive?
Yes. Many modern dashboards include filters, slicers, drill down options or clickable visuals that help users explore the data in more detail.
How does Skald BI relate to dashboards?
Skald BI helps teams share existing Power BI dashboards and reports through a secure branded portal, especially when content needs to reach customers, partners or larger internal audiences.