


Data intersections are points where two or more categories, dimensions or filters meet in a dataset. They help show a value for a specific combination of data.
Data intersections
Data intersections are points where two or more data categories meet, helping users compare information across dimensions.
Quick facts about data intersections

Category overlap
A data intersection shows where different categories, filters or dimensions overlap in a dataset.

Comparison point
Intersections help users compare values across dimensions such as region, product, time period or customer segment.

Used in visuals
Charts, tables and matrices often show data intersections to help users understand how one category relates to another.

Supports analysis
Data intersections help reveal patterns that may not be visible when each category is viewed separately.
How data intersections work
Data intersections appear when analytics tools combine dimensions and measures. For example, a report might show revenue by product and region. Each value in the table or chart represents the intersection between a product, a region and the selected measure. Common examples of data intersections include:
- Revenue for one product in one market
- Orders for one customer segment during one month
- Support tickets by priority and department
- Margin by product category and sales channel
These intersections make reports more useful because they help users move beyond totals. Instead of only seeing overall revenue, teams can understand which combinations of categories are driving performance.
Why data intersections matter in BI reporting
Data intersections help users answer more specific business questions. Instead of only seeing total revenue, a team can compare revenue by product, region, customer segment or time period.
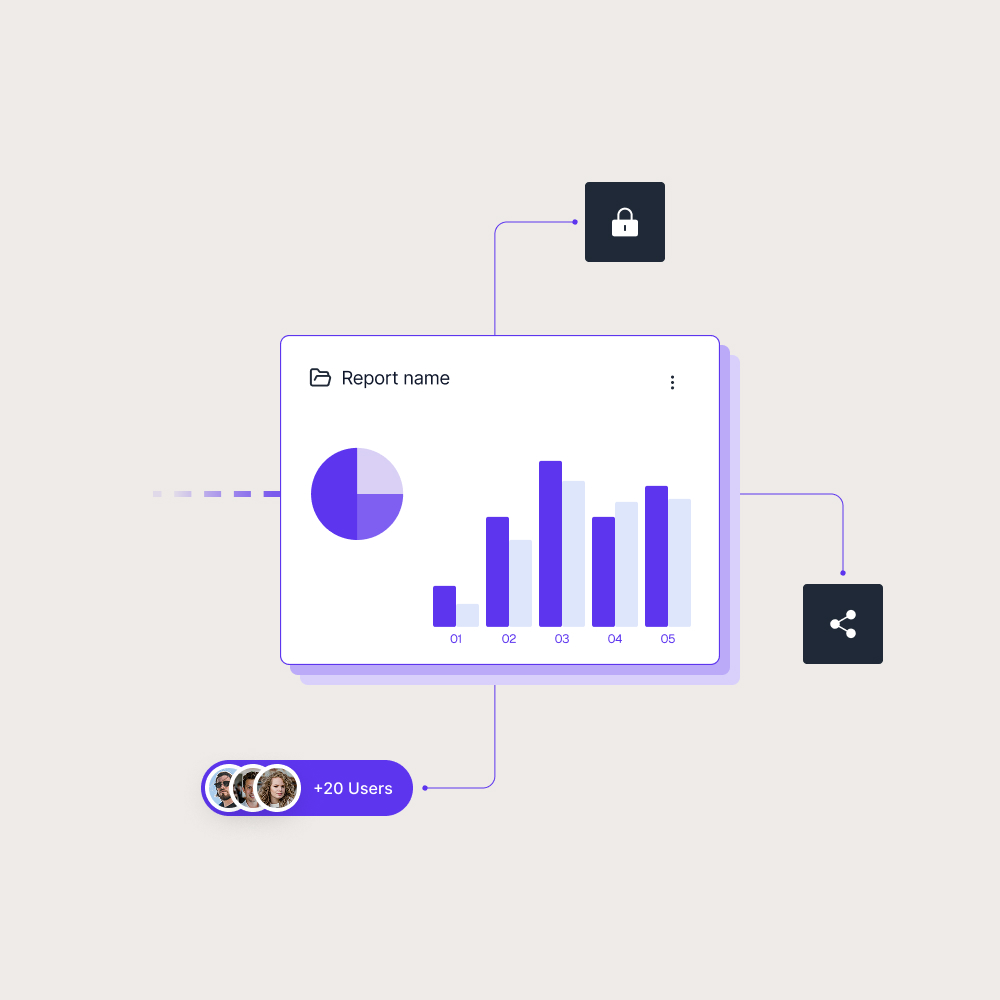
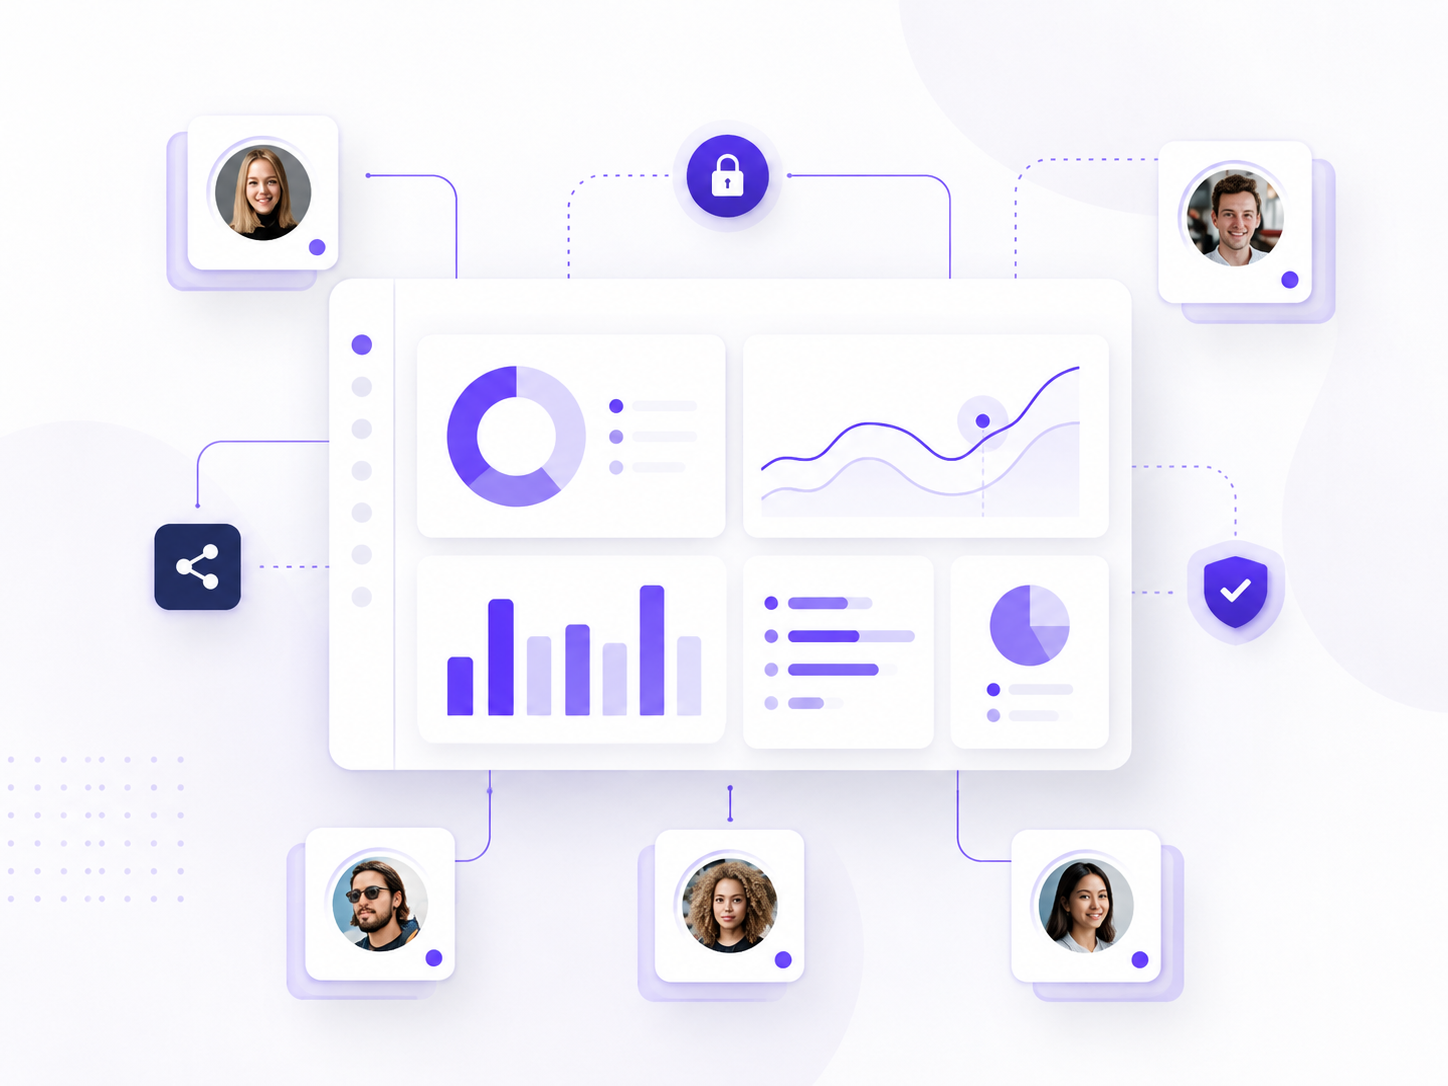
In Power BI, intersections often appear in matrices, charts and drill down views. Skald BI helps teams share those reports through a secure branded portal, so customers, partners and internal users can access the right views in a controlled experience.
Use cases
See how different types of organisations use Skald BI to share Power BI securely with employees, customers and partners.
Contact us
Try Skald BI for free
Whether you’re looking for expert advice, tailored
solutions, or have a specific inquiry, reach out to
our team.
No set up. Live fast.
Support contact
Follow us
Frequently asked questions
What is an example of a data intersection?
An example is revenue for one product in one region during one month. The value represents the intersection of product, region, time and revenue.
Why are data intersections useful?
Data intersections help users compare performance across multiple dimensions. They can reveal patterns that are not visible in totals alone.
Where do data intersections appear in Power BI?
Data intersections can appear in tables, matrices, charts, filters and drill down views where measures are shown across multiple dimensions.
How do data intersections relate to Skald BI?