


Qlik is a business intelligence and analytics platform used to connect data, create dashboards and explore insights.
Qlik
Qlik is a business intelligence and analytics platform used to connect data, create dashboards and explore business insights. Qlik describes its platform around data integration, analytics and AI capabilities, with products such as Qlik Cloud Analytics and Qlik Sense.
Quick facts about Qlik

Data analytics
Qlik helps teams analyze business data through interactive dashboards, reports and visual analytics.

Associative engine
Qlik is known for its associative analytics engine, which helps users explore relationships across data instead of only following predefined query paths.

Reports and dashboards
Power BI is used to create interactive reports and dashboards that help teams monitor performance and analyze trends.

Data integration
Qlik also provides data integration tools for moving, preparing and managing data across different systems.
How Qlik works
Qlik is used to bring data together and turn it into dashboards, reports and visual analytics. Teams can use Qlik to explore data, find relationships and make business information easier to understand. A simple Qlik workflow often looks like this:
- Connect business data
- Prepare and model data
- Build dashboards and visualizations
- Share analytics with users
This makes Qlik relevant for teams that need business intelligence, self service analytics and data exploration. As with other BI platforms, the challenge often grows when analytics need to reach more users, external audiences or customer facing environments.

Where Qlik fits in the BI landscape
Qlik is one of the established business intelligence platforms used by organizations that want to analyze data and create interactive dashboards. It is often compared with tools such as Power BI and Tableau because all three help teams turn data into visual reporting and analytics.
For Skald BI, Qlik is relevant as part of the broader BI landscape. Skald BI is focused on Power BI report distribution, but many of the same business questions apply across BI tools: who needs access, how reports are shared, how users experience analytics and how organizations keep control as reporting grows.
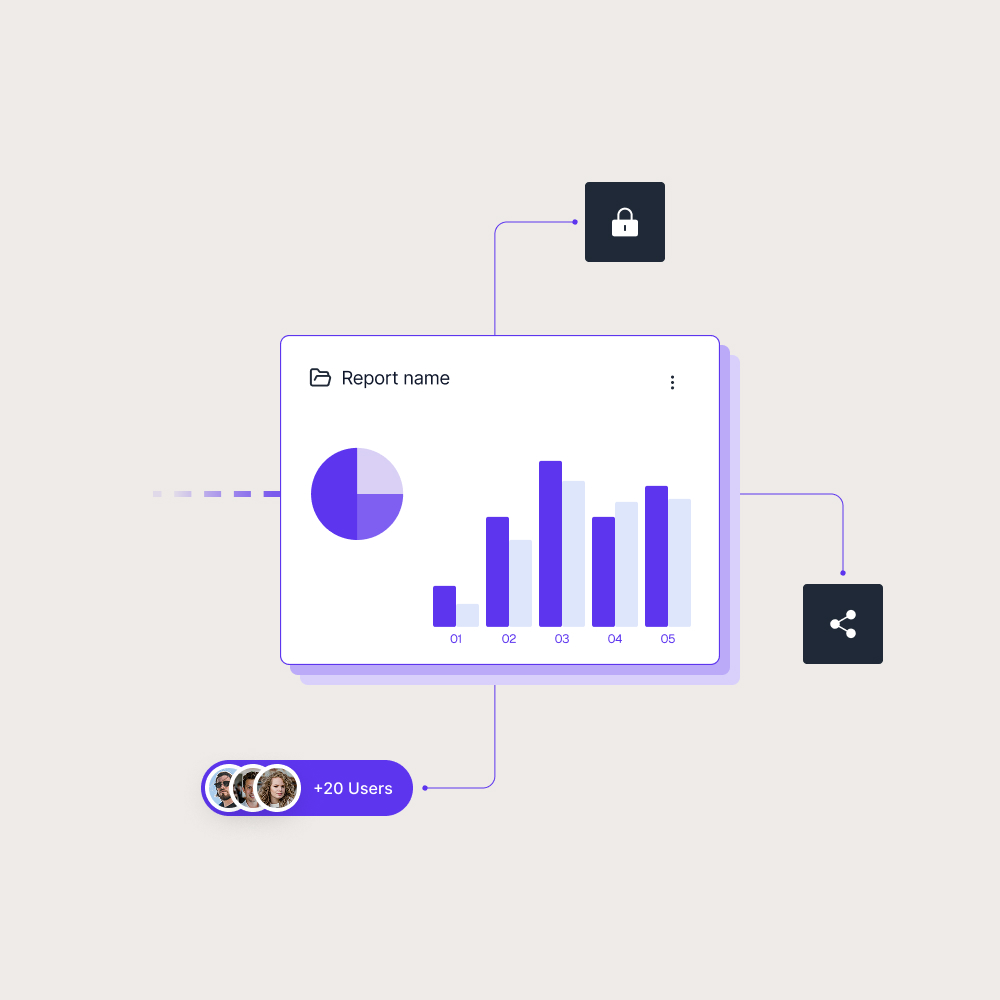
Qlik helps teams work with data and analytics. Skald BI focuses on making existing Power BI reports easier to share through a secure branded portal.
Use cases
See how different types of organisations use Skald BI to share Power BI securely with employees, customers and partners.
Contact us
Try Skald BI for free
Whether you’re looking for expert advice, tailored
solutions, or have a specific inquiry, reach out to
our team.
No set up. Live fast.
Support contact
Follow us
Frequently asked questions
Qlik is used for data analytics, dashboarding, business intelligence, reporting and data exploration across business data sources.
No. Qlik and Power BI are separate BI platforms. Both are used for analytics and reporting, but they have different ecosystems, product structures and approaches to data exploration.
How is Qlik relevant to Skald BI?
Qlik is relevant as another major BI platform in the analytics market. Skald BI is specifically built around Power BI and helps teams share existing Power BI reports through a secure branded portal.
How does Skald BI work with Power BI?
Skald BI works around existing Power BI reports. Teams keep creating reports in Power BI, while Skald BI provides a secure branded portal layer for publishing and sharing those reports with customers, partners and internal users.