


A dimension table is a table that contains descriptive attributes used to group, filter or explain data in a BI model.
Dimension table
A dimension table is a table that stores descriptive data used to group, filter and explain values in a BI model.
Quick facts about dimension tables

Describes business data
A dimension table contains attributes such as product name, customer type, region, date or department.

Works with fact tables
Dimension tables are commonly used together with fact tables, where the fact table stores measurable events or values.

Supports filtering
Dimension tables help users filter measures by categories such as product, customer, region, date or department.

Improves model clarity
Well structured dimension tables make Power BI models easier to build, maintain and understand.
The table that gives numbers context
A dimension table helps explain what a number belongs to. For example, a sales amount in a fact table becomes more useful when it can be analyzed by product, customer, region or date. Common dimension table examples include:
- Product table
- Customer table
- Date table
- Region table
This structure helps users move from a total number to a more useful reporting view. Instead of only seeing total sales, they can analyze sales by product category, customer segment, month or market.
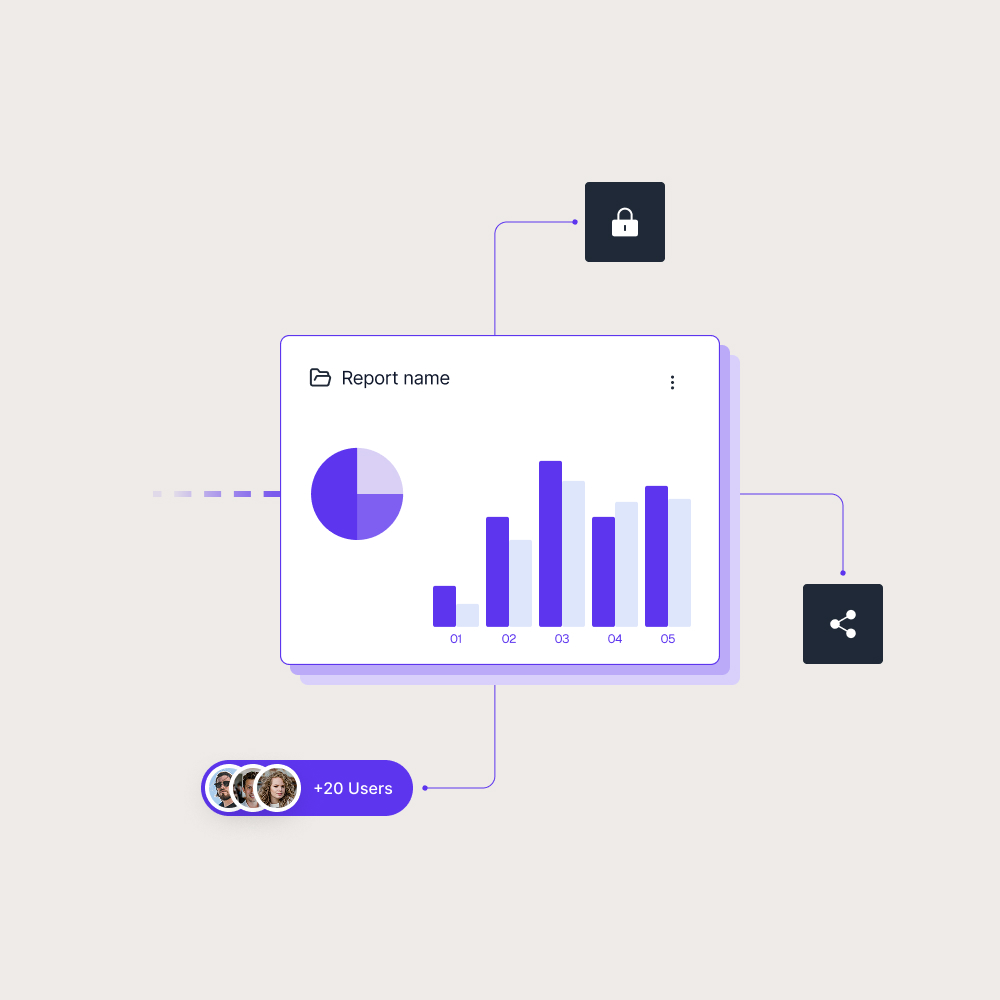

Why Power BI models need clear descriptive tables
Dimension tables matter because they make Power BI models easier to use. When descriptive fields are organized properly, report creators can build clearer visuals, filters and drill down views without repeating the same logic across reports.
A good dimension table also helps users trust the report experience. It gives measures a stable structure, so people can compare results by the categories that matter to the business. Skald BI helps teams share finished Power BI reports through a secure branded portal, so customers, partners and internal users can access structured reporting views with the right context.
Use cases
See how different types of organisations use Skald BI to share Power BI securely with employees, customers and partners.
Contact us
Try Skald BI for free
Whether you’re looking for expert advice, tailored
solutions, or have a specific inquiry, reach out to
our team.
No set up. Live fast.
Support contact
Follow us
Frequently asked questions
What is an example of a dimension table?
Examples include product, customer, date, region, department and sales channel tables.
What is the difference between a dimension table and a fact table?
A dimension table describes the data. A fact table usually stores measurable values or events, such as sales, orders, costs or transactions.
How are dimension tables used in Power BI?
In Power BI, dimension tables are used to filter, group and structure report data, often together with fact tables and measures.
How do dimension tables relate to Skald BI?