


KPI stands for key performance indicator. It is a metric used to measure progress toward a specific goal.
KPI
A KPI is a key performance indicator used to measure progress toward a specific business goal.
Quick facts about KPIs

Performance metric
A KPI measures performance in an area that matters to the business, such as revenue, retention, cost or delivery time.

Linked to goals
Good KPIs are connected to clear objectives, not just numbers that are easy to track.

Used in reporting
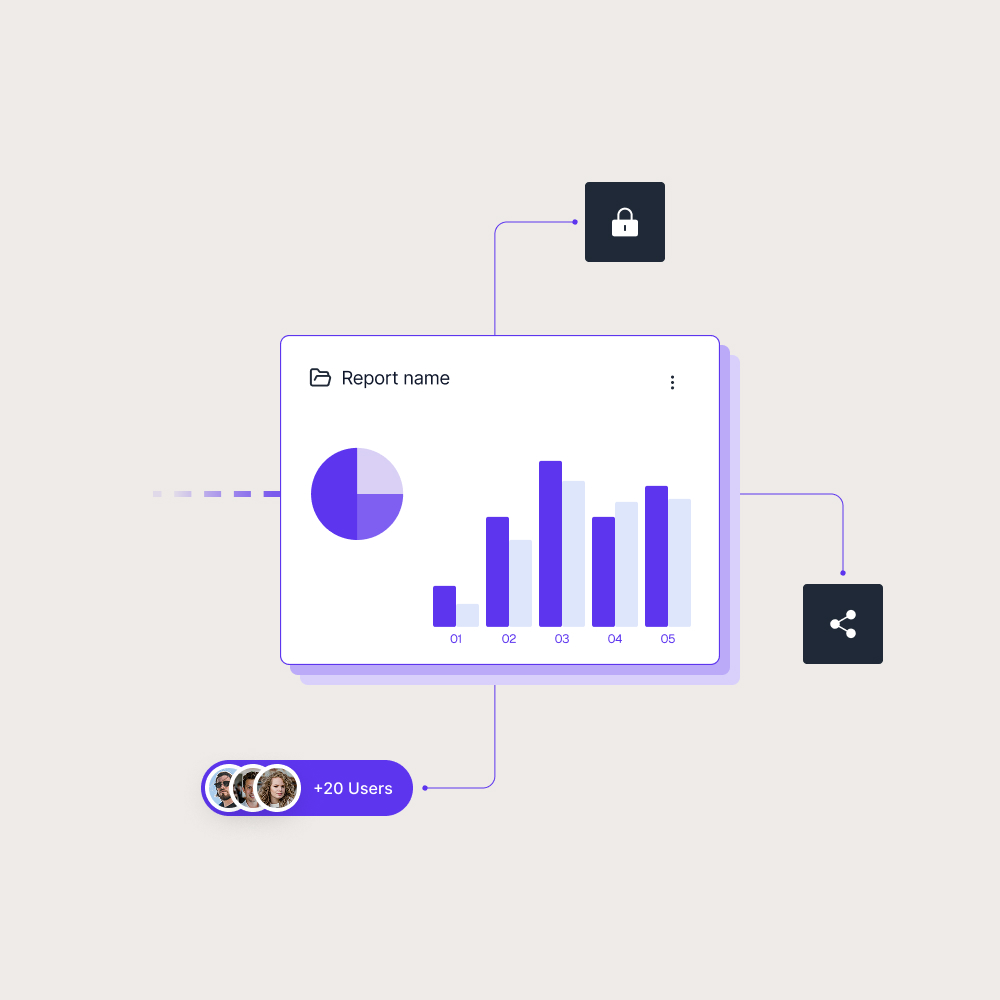
KPIs are often shown in dashboards, scorecards and reports so teams can monitor progress over time.

Needs context
A KPI is more useful when users can see targets, trends, comparisons or thresholds alongside the value.
How KPIs work
KPIs help teams focus on the measurements that matter most. Instead of tracking every available number, a report can highlight the indicators that show whether performance is moving in the right direction.
Common KPI examples include:
- Revenue growth
- Customer retention
- Conversion rate
- Support response time
KPIs should be easy to understand and tied to the decisions users need to make. A KPI without context can be misleading, especially if users cannot see the target, time period or definition behind the number.

Why KPIs matter in BI reporting
KPIs matter because they turn reporting into a clearer view of progress. They help users see whether a business area is on track, where attention is needed and how performance changes over time.
In Power BI, KPIs can appear in cards, tables, scorecards, dashboards and report pages. Skald BI helps teams share finished Power BI reports through a secure branded portal, so customers, partners and internal users can access the right KPIs in a controlled experience.
Use cases
See how different types of organisations use Skald BI to share Power BI securely with employees, customers and partners.
Contact us
Try Skald BI for free
Whether you’re looking for expert advice, tailored
solutions, or have a specific inquiry, reach out to
our team.
No set up. Live fast.
Support contact
Follow us
Frequently asked questions
Examples of KPIs include revenue growth, customer retention, conversion rate, churn rate, support response time and profit margin.
KPIs help teams focus on the metrics that matter most for business performance and decision making.
What is the difference between a KPI and a metric?
A metric is any measurement. A KPI is a metric that is directly connected to an important business goal.
How do KPIs relate to Skald BI?