
Power BI Embedded Pricing: What It Really Means for Sharing Reports, latest update
⏲ Read time: 8 minutes

Power BI Embedded pricing is not a simple per-viewer price. For production embedded analytics, the central commercial decision is how much capacity and operational ownership are needed to deliver a reliable reporting experience.
That distinction matters when an organisation is deciding how to share Power BI reports with customers, partners or other external audiences. A deeply integrated analytics feature inside a software product may justify a custom embedded application. A team that mainly needs controlled, branded distribution of reports may be solving a different problem.
This guide explains the current capacity model, the licensing fork between sharing scenarios, the workload variables that affect cost and the operating costs that do not appear as a single Azure or Fabric line item.
What Power BI Embedded pricing pays for
In production, Microsoft requires capacity to publish embedded Power BI content. The relevant capacity families can include A, EM, P and F, depending on the embedding scenario, existing licensing and commercial context. Capacity is a pool of compute resources; the selected capacity tier determines the resources available to serve report queries, interactions and related workloads.
For an app-owns-data design, the application authenticates its users and presents Power BI content within its own experience. The capacity is therefore only one part of the delivery model. The organisation also has to design and operate the application, identity and access controls around the reports.
Current capacity options: A, F and existing P/EM context
| Capacity conversation | What it means for evaluation |
|---|---|
| A SKU | Microsoft Azure Power BI Embedded capacity and the clearest direct Azure consumption model for many app-owns-data designs. Microsoft documents hourly billing, no commitment, and the ability to scale or pause the resource. Pausing is necessary to stop billing, so it must be treated as an operational decision rather than an automatic saving. |
| F SKU | Microsoft Fabric capacity can also support embedded Power BI items. It brings a broader Fabric-capacity context, with on-demand resizing and pause/resume capabilities. Do not assume that an F SKU is interchangeable with, or price-equivalent to, an A SKU. |
| P or EM capacity | These families may remain relevant where an organisation already has particular Power BI licensing or capacity arrangements, or where the sharing architecture is not app-owns-data. They should be evaluated against the actual tenant, audience and licensing design rather than treated as a universal Embedded price option. |
Microsoft maps some F and Power BI capacity tiers for approximate resource context. That mapping is not a price equivalence statement. Regional prices, purchase routes, currency and commercial agreements can change the result, so use the current Azure Power BI Embedded pricing page for a named region and currency.
Licensing depends on the sharing scenario
One of the most important distinctions is between embed for your customers (app owns data) and sharing content with users who access the Power BI service or a Microsoft 365 experience.
- App-owns-data external viewers: Microsoft states that end users do not need Power BI licences to consume embedded content in this scenario. Production still requires capacity, an embedding identity and appropriate arrangements for creating, publishing, administering and operating the content.
- Embed for your organisation or native service sharing: the viewer licensing outcome can be different. Microsoft states that free users consuming Power BI service content require P or F64-and-higher capacity; on A capacity or F SKUs below F64, viewers need Pro, PPU or an individual trial where applicable.
- Entra B2B external sharing: this is a separate architecture. External guests may need an assigned per-user licence or may bring an appropriate licence from their own organisation where the chosen sharing model requires it.
“External user” is therefore not enough information to calculate licensing. First identify whether the application owns the data experience, whether users enter the Power BI service and who owns authentication and access decisions.
Why static online price tables are a weak decision method
Online articles often turn an hourly capacity figure into a monthly estimate or suggest a universal viewer-count break-even point. Those illustrations can be misleading because they may omit region, currency, agreement type, operating hours, workload peaks, existing commitments and the cost of running the application.
Microsoft describes Azure prices as estimates rather than actual quotes. A durable evaluation should therefore use current Microsoft pricing for the target region and then test the workload, instead of treating a published table as a promise.
What actually drives capacity demand
Capacity sizing should begin with observable workload inputs, not audience size alone. Record these assumptions before requesting an estimate or starting a proof of concept:
- Concurrency and peaks: how many sessions interact with reports at the same time, and when demand concentrates.
- Report interaction: whether users mainly view summary pages or perform filtering, drill-through, slicing and detailed exploration.
- Report and semantic-model complexity: visual count, DAX/query complexity, model size, storage mode and the number of reports sharing models.
- Refresh and data sources: refresh frequency, gateway or source dependencies, refresh duration and overlapping query demand.
- Tenant and security design: number of customers or organisations, RLS patterns, identity lookups and any tenant-specific model or workspace approach.
- Service expectations: acceptable loading and interaction behaviour, support hours and whether the reporting experience must be available continuously.
Refresh is a capacity consideration in its own right. Microsoft notes that semantic-model refresh consumes memory and that a full refresh can require roughly twice the model’s memory footprint while queries are being served. When capacity is exhausted, refresh activity can be delayed or skipped. Treat that as a planning factor, not as a universal formula for selecting a SKU.
The total cost of ownership beyond capacity
A realistic Power BI Embedded business case should separate the Microsoft consumption line from the work required to make the service dependable:
- Capacity and licensing: selected A, F, P or EM capacity, plus creator, administrator or publishing arrangements required by the design.
- Application and identity: authentication, embedding identity or service principal configuration, token generation, user provisioning and tenant mapping.
- Report engineering: model optimisation, report design, RLS implementation, refresh and data-source operations.
- Security and governance: workspace permissions, access reviews, separation between customers, release controls and testing of customer-specific visibility.
- Operations: capacity monitoring, alerting, resizing, incident response, support and performance remediation.
- Product ownership: application development, UX, release management and ongoing changes when analytics is part of a customer-facing product.
Microsoft recommends monitoring capacity operations with the Fabric Capacity Metrics app. Monitoring is not optional in a customer-facing design: it is how a team discovers sustained pressure, peak demand and the need to resize or optimise.
Pause, resume and scaling: flexibility with conditions
A SKU capacity can be scaled and paused, and F capacity also supports on-demand resizing and pause/resume. This flexibility can help with development, testing or non-continuous workloads. It does not make a capacity-free architecture, and it is not a substitute for planning reliable availability.
If customers expect reporting to be available at any time, pausing may create an outage or require an operational wake-up process. Include startup behaviour, availability expectations and ownership of the schedule in the cost decision. Capacity should be resized or paused only when the service design and user expectations support it.
Which sharing architecture fits the problem?
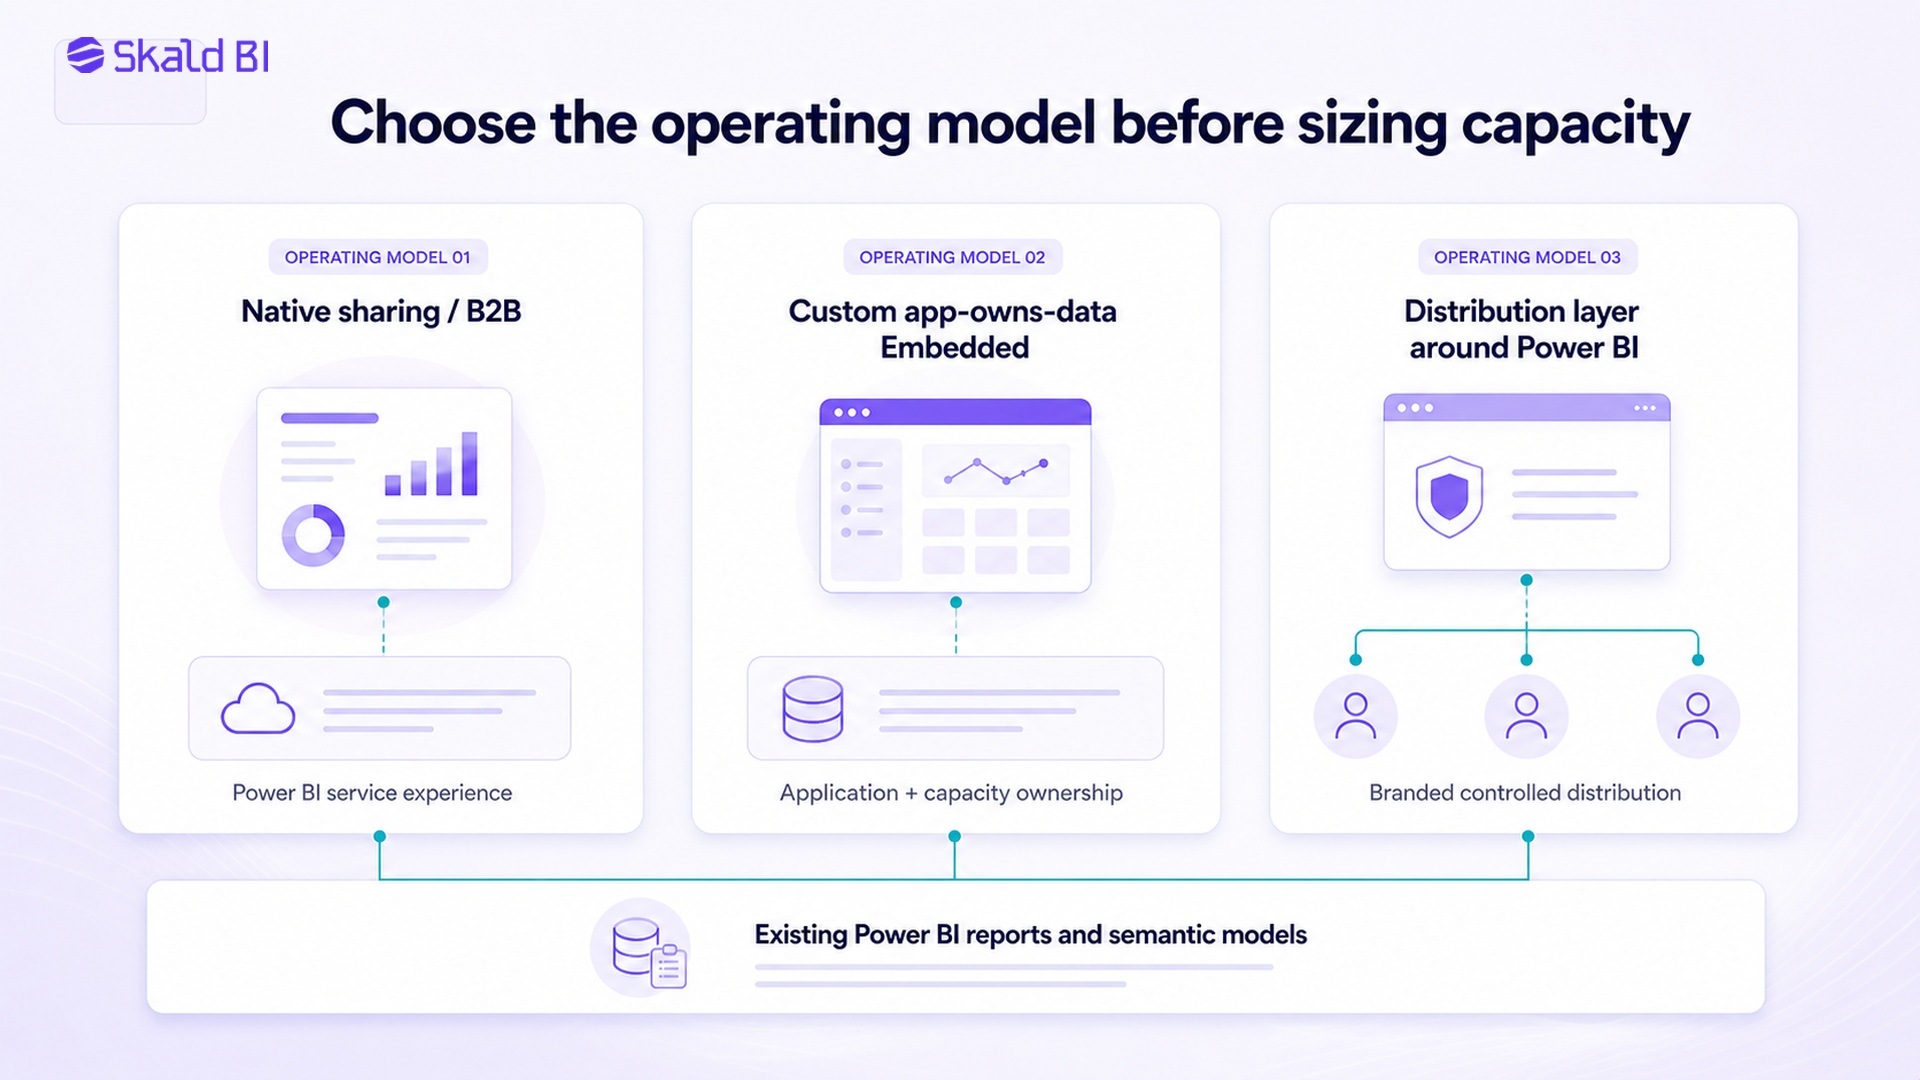
| Need | Architecture to investigate | Main trade-off |
|---|---|---|
| Small, governed internal collaboration | Native Power BI sharing, apps or workspaces | Usually the simplest route, but the Power BI service experience and viewer licensing rules remain part of the design. |
| External guests who can use an identity and service-based sharing model | Microsoft Entra B2B and native Power BI distribution | Can avoid building an application, but guest access, tenant boundaries, user licensing and customer experience need to be accepted. |
| Analytics deeply integrated into a SaaS product | Custom app-owns-data Embedded implementation | Maximum control over the product experience, with corresponding application, identity, security, capacity and operations ownership. |
| Existing reports mainly need branded, controlled customer or partner distribution | Evaluate a distribution or portal layer around Power BI | Can address the distribution experience without treating a full bespoke analytics application as the default project; product fit and integration requirements still need validation. |
Skald BI is relevant to the last decision context. It is a distribution layer for existing Power BI reports, not a replacement for Power BI, its report authoring workflow or Microsoft capacity and licensing requirements. If the main requirement is a branded, controlled way to distribute reports rather than analytics becoming part of a software product, compare the operational scope of a portal layer with the scope of building and maintaining custom embedding.
A practical Power BI Embedded cost evaluation
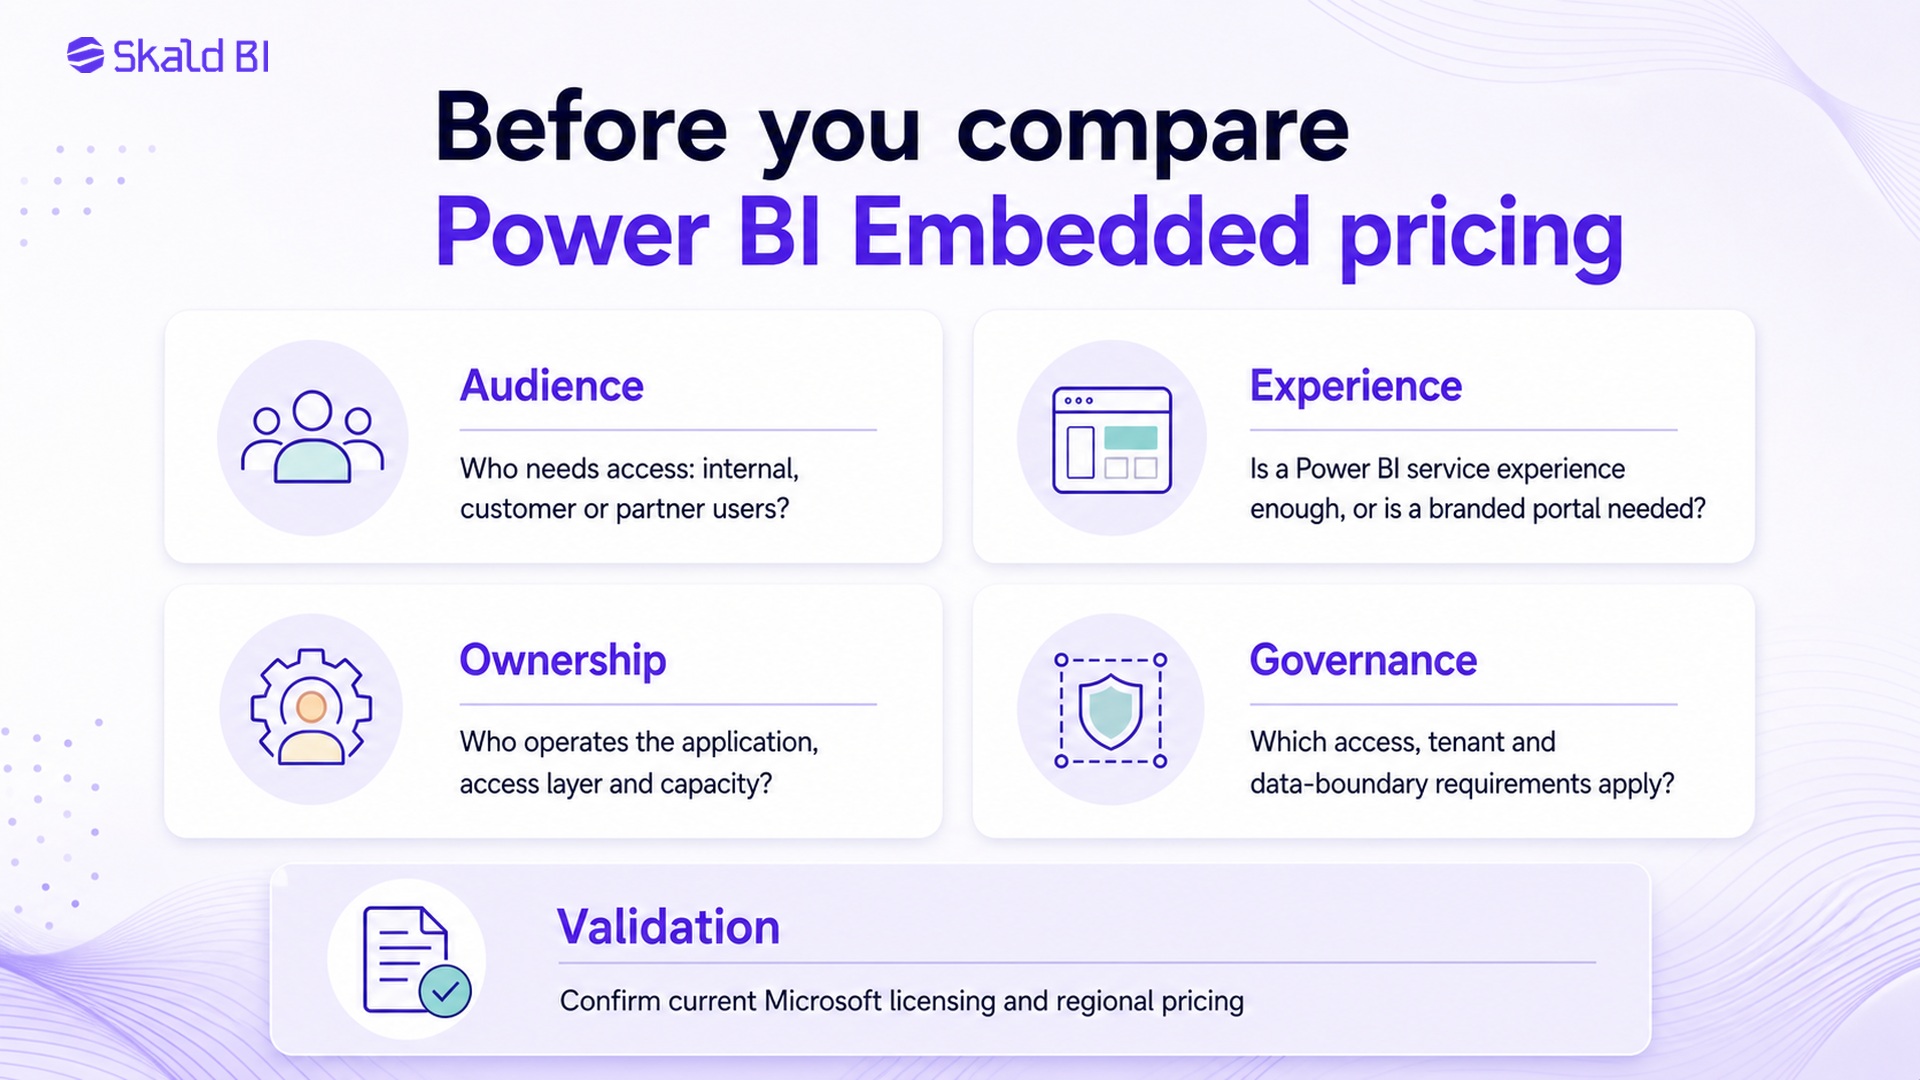
Use this sequence before committing to a SKU or architecture:
- Define the audience and access scenario. Separate employees, Entra B2B guests, customers and partners. Decide whether users consume through the Power BI service or an application-owned experience.
- Describe the required experience. State whether the requirement is native collaboration, a branded portal or analytics integrated into a product.
- Measure the workload. Capture concurrent sessions, peak windows, report interactions, model sizes, refresh demand and data-source dependencies.
- Model the operating work. Assign ownership for identity, tenant mapping, RLS testing, publishing, monitoring, support and incident response.
- Price the right capacity context. Check current regional Azure or Fabric pricing and document assumptions about hours, resizing, pause/resume and existing commitments.
- Run a representative proof of concept. Test realistic reports, models, refreshes and peak interactions. Do not infer a universal users-per-SKU number from a different workload.
- Review the service boundary. Confirm what the team will build itself and whether a distribution layer could solve the distribution problem with less portal and administration ownership.
Questions to answer before requesting a quote
- Which Microsoft capacity family and sharing scenario applies to the proposed architecture?
- Are external users consuming through an app-owns-data experience, the Power BI service, or Entra B2B sharing?
- What are the measured concurrency, peak, refresh and interaction assumptions?
- Who owns authentication, embedding identity, tenant mapping, RLS validation and access reviews?
- Who will monitor capacity and respond to throttling, failed refreshes or slow interactions?
- Does the service need continuous availability, or can capacity be paused during defined periods?
- Is the organisation building a product feature, or distributing existing reports to approved audiences?
Final view: price the operating model, not just the SKU
Power BI Embedded pricing is capacity-led, but the right capacity cannot be selected responsibly from viewer numbers or a static online table. The architecture determines the licensing path, the workload determines capacity demand and the product or portal boundary determines how much engineering and operational ownership sits with your team.
Custom app-owns-data embedding can be appropriate when analytics is a core part of a software product. Native sharing or Entra B2B may be sufficient for smaller, governed collaboration scenarios. When the need is primarily to distribute existing Power BI reports to customers or partners through a branded and controlled experience, a distribution layer may deserve a direct comparison with custom embedding.
Before choosing, make the assumptions visible, test a representative workload and price the full operating model.
Talk to Skald BI about your report-distribution requirements if you are comparing direct Power BI sharing, custom Embedded development and a managed distribution-layer approach.
Sources and further reading
- Microsoft Learn: Capacity and SKUs in Power BI embedded analytics
- Microsoft Azure: Power BI Embedded pricing
- Microsoft Learn: Embed for your customers
- Microsoft Learn: Content distribution and sharing
- Microsoft Learn: Data refresh in Power BI
- Microsoft Learn: Fabric features by SKU and capacity type
Table of contents
- What Power BI Embedded pricing pays for
- Current capacity options: A, F and existing P/EM context
- Licensing depends on the sharing scenario
- Why static online price tables are a weak decision method
- What actually drives capacity demand
- The total cost of ownership beyond capacity
- Pause, resume and scaling: flexibility with conditions
- Which sharing architecture fits the problem?
- A practical Power BI Embedded cost evaluation
- Questions to answer before requesting a quote
- Final view: price the operating model, not just the SKU
- Sources and further reading

About the author
Mathias Melander
As Head of Product & Analytics at Skald BI, Mathias Melander leads the platform’s product strategy, technical architecture and analytics development. His focus is helping companies distribute Power BI reports securely through scalable, customer-facing BI portals.
Related articles

BI Data Visualization: How to Build Reports People Can Act On
Learn how to create clearer Power BI data visualizations and share reports securely with customers, partners and teams.
Read more
White Label Power BI Portal: Sharing Reports Securely Beyond the Workspace
Learn what a Power BI portal is, when it is useful, and how to share Power BI reports securely with customers, partners and teams.
Read more
Power BI sharing: how to share reports securely with the right users
Learn how Power BI sharing works across reports, dashboards, workspaces, external users, licenses, RLS and secure branded portals.
Read more