What is Power BI? A practical guide for teams that need better reporting and better sharing
⏲ Read time: 9 minutes

Power BI is Microsoft’s business analytics platform for turning business data into interactive reports, dashboards and insights. It helps teams connect to data sources, prepare data, build reports and make information easier to understand.
For many companies, Power BI becomes the place where reporting is created, reviewed and discussed. Sales teams use it to follow pipeline and revenue. Finance teams use it to monitor margin, forecast accuracy and monthly performance. Operations teams use it to track delivery, capacity or service levels. Leadership uses it to understand trends across the business without waiting for static spreadsheets or manual reporting packs.
For teams using Skald BI, there is another important angle. Power BI is powerful for creating reports, but creating a report is not the same as delivering it to every person who needs it. Once reports need to reach customers, partners, external stakeholders or larger internal audiences, the challenge expands into access, licensing, user experience and governance. This guide explains Power BI in practical terms, then moves into the questions that matter when reports need to be shared at scale.
Power BI in simple terms
Power BI helps organizations turn business data into visual reports that people can explore. Instead of looking at raw tables or static exports, users can interact with charts, filters, metrics and report pages. This makes it easier to answer questions such as what changed, where performance improved, which segment is underperforming and what needs attention.
A typical Power BI setup starts with data from Excel files, databases, cloud applications, business systems or a data warehouse. That data is prepared, modeled and turned into visuals that show performance in a more usable format. Data specialists can build trusted models and reporting logic, while business users can explore the finished reports without writing code or querying databases. The value is not just visualization. The value is giving an organization a shared way to understand what is happening.
The main parts of Power BI
Power BI includes different tools and services that support different parts of the reporting process. The two most important parts for most teams are Power BI Desktop and the Power BI service.
Power BI Desktop is where many reports are created. Report creators use it to connect to data, build data models, create calculations and design report pages. The Power BI service is the cloud environment where reports are published, accessed, shared and managed. In simple terms, Desktop is where many reports are built, while the service is where many reports are consumed and shared.
Reports and dashboards
A Power BI report is an interactive collection of visuals built from a data model. Reports can include several pages, charts, tables, filters and slicers. Users can explore the data by selecting visuals, filtering by dimension or moving between pages. A dashboard is usually a higher level view of selected visuals, designed to show important metrics quickly.
A finance team might use a dashboard to see revenue, margin and cash flow at a glance, then use a report to explore revenue by market, customer, product group or time period. Both formats help people understand performance, but they support different levels of decision making. The format matters, but the experience around access and delivery matters too.
![]()
Why companies choose Power BI
Companies use Power BI because it gives them a more structured way to work with business data. Instead of relying only on spreadsheets, static exports or manual presentations, teams can create interactive reports that update as data changes. This can make reporting more consistent and reduce the time spent recreating the same information every week or month.
Power BI also fits naturally into many Microsoft environments. Organizations that already work with Microsoft 365, Excel, Teams, SharePoint, Azure or Fabric often find Power BI easier to adopt than a completely separate analytics stack. The strongest use cases usually appear when reporting is recurring, because the same metrics need to be reviewed again and again by the same teams.
Good reports also create a shared language inside the business. When teams use the same definitions, metrics and data models, discussions become more focused. Instead of debating which spreadsheet is correct, people can spend more time discussing what the numbers mean and what action should follow.
Where Power BI starts to become harder
Most Power BI projects do not become difficult because the first report is impossible to build. They become difficult when usage grows. More reports, more departments, more viewers and more external stakeholders all create new questions around access, licensing and delivery.
At a small scale, a team might share reports with a few internal users and manage permissions manually. At a larger scale, the same approach can become harder to maintain. Teams need to know who should see each report, how users should log in, whether external users need access, how licensing works and how report access should be governed over time.
The challenge becomes even more visible when Power BI reports are part of a customer or partner experience. A standard report link may work technically, but it may not create the kind of experience a company wants to give external users. Customers and partners often need a clearer place to access insights, with the company’s brand, simple navigation and controlled access to only the reports that are relevant to them.
Building reports is not the same as sharing reports
This distinction is central for Skald BI. Power BI helps teams build valuable reports, but report creation and report delivery are different problems. A report can be accurate, useful and well designed, while the business value is still limited if the right people cannot access it easily.
A large internal audience may need a simple way to find reports without repeated access requests. A customer may need a branded reporting experience that feels like part of the company’s own platform. A partner may need access to selected dashboards, but not to the full Power BI workspace. This is where the reporting conversation moves beyond charts and dashboards into audience, access, login, organization and administration. When usage grows, teams usually need to solve several related problems at the same time:
-
Make sure each user can access the reports and data they are allowed to see.
-
Manage permissions as more reports, users and audiences are added.
-
Give customers and partners a clear place to access reporting content.
-
Keep the reporting experience consistent without creating more manual work for BI and IT teams.
These challenges affect more than technical administration. They influence adoption, trust and perceived quality. If users receive scattered links, move through unfamiliar login flows or depend on manual access requests, reporting can start to feel fragmented. For customer and partner reporting, that experience becomes part of how the company presents its insight externally.
![]()
Licensing, access and governance
Power BI licensing depends on how content is created, shared and consumed. Microsoft provides different license and capacity models, and the right setup depends on the organization’s use case. In many native sharing scenarios, report creators and recipients need the correct Power BI licenses unless the content is hosted in eligible capacity. This is why licensing becomes an important topic when many users only need to view reports.
Access planning matters just as much. Teams need to understand who gets access to each report, who gets access to the underlying semantic model and which data each user is allowed to see. Power BI supports security concepts such as Row Level Security, but organizations still need a clear model for how permissions are designed, maintained and reviewed. This is where governance becomes practical rather than theoretical.
What is PowerBI Embedded?
Power BI Embedded is used when organizations want to embed Power BI reports, dashboards or analytics into applications, websites or portals. It is often relevant when a company wants customers or external users to view Power BI content inside a branded experience rather than inside the standard Power BI interface.
This can be powerful, but it is also a technical path. Teams need to think about authentication, embedding, permissions, capacity, user experience and maintenance. For organizations with dedicated development resources, building a custom embedded analytics experience can be the right solution. For other teams, the goal is simpler. They already have useful Power BI reports and want a better way to publish, present and control access to those reports for different audiences.
A Power BI portal layer can help close that gap. It can sit around existing reports and support the delivery experience, including branding, access control, navigation and user management. This is not about replacing Power BI. It is about making Power BI reports easier to deliver to the people who need them.
Where Skald BI fits
Skald BI is built for organizations that already use Power BI and need a better way to share reports with people inside or outside the organization. It does not replace the Power BI reporting workflow. Instead, it adds a secure, branded sharing layer around existing Power BI reports so teams can publish insights to employees, customers and partners with more control.
This is especially relevant when Power BI reports need to be delivered as part of a customer portal, partner portal, internal reporting hub or SaaS analytics experience. The BI team can keep building and maintaining reports in Power BI, while Skald BI helps manage the surrounding experience around access, presentation and distribution. For teams that have outgrown simple report links, this distinction matters. Power BI remains the analytics engine. Skald BI supports the distribution experience around it.
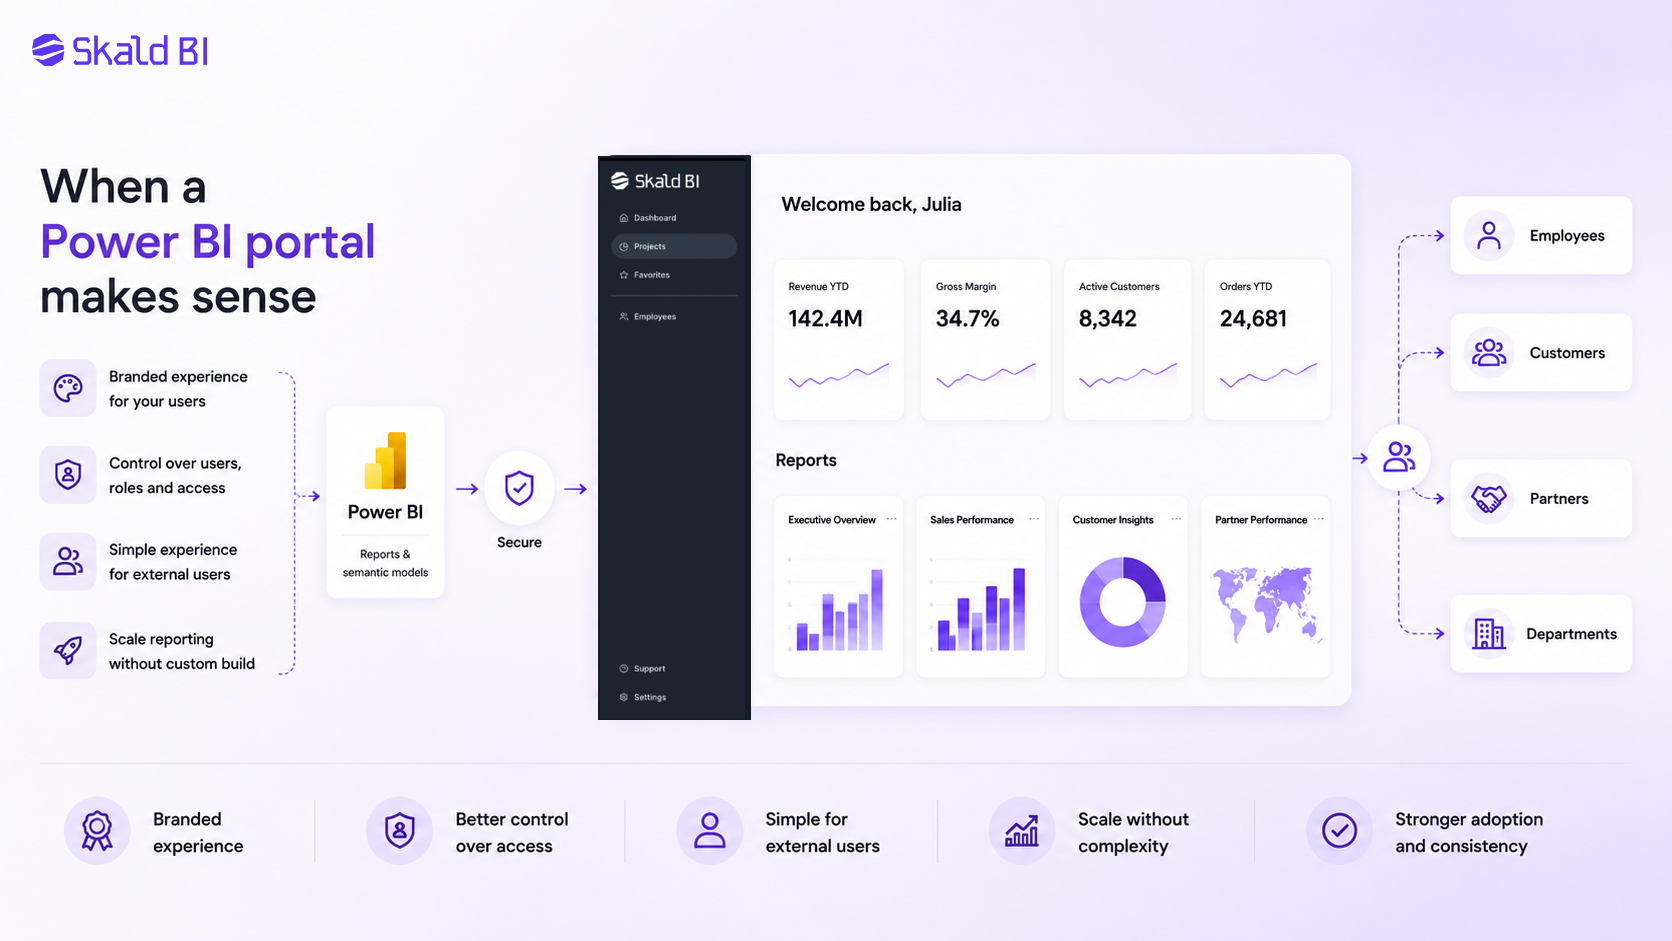
When a Power BI portal makes sense
A Power BI portal makes sense when report access needs to scale beyond a small internal audience. If a company only shares a few reports with a few internal users, native Power BI sharing may be enough. But when the audience includes customers, partners, departments or many viewer groups, a portal can make the experience easier to manage. The need often becomes clear when several things start happening at the same time:
-
Users need a branded place to access reports instead of scattered links or a generic Power BI experience.
-
Teams need better control over users, roles, customer groups and report access as the audience grows.
-
External stakeholders need a simpler login and navigation experience.
-
The organization wants to scale reporting without building and maintaining a custom portal from scratch.
A portal is not only a design layer. It creates structure around report delivery. That structure can support adoption, reduce manual administration and make reporting more consistent across different audiences. It also gives companies a clearer way to present Power BI content as part of their own service, product or internal reporting environment.
A practical way to think about your Power BI setup
Before choosing how to use Power BI, it helps to separate three questions. How will reports be created and maintained? Who needs to consume those reports? What experience should users have when they access them?
Those questions sound simple, but they lead to different decisions. A setup that works well for internal analysis may not be the right setup for customer reporting. A dashboard used by a finance team may need different access rules when shared with external partners. A report that is easy to use inside Power BI may need clearer navigation, stronger branding and tighter permission management when it becomes part of a customer experience. The best Power BI setup reflects how the organization actually uses reports.
So, what is Power BI?
Power BI is a Microsoft platform for turning business data into interactive reports and dashboards. It helps teams connect to data, build visual reports, explore trends and share insights. It is widely used because it brings data modeling, visualization and collaboration into a Microsoft based analytics environment.
For organizations, the practical question is not only what Power BI is. The more important question is how Power BI should be used. If the goal is to build internal reports for a small group, Power BI may be enough on its own. If the goal is to share reports with customers, partners or larger groups of users, teams also need a plan for access, licensing, branding and report delivery. That is the gap Skald BI is designed to support. Power BI helps you create the reports. Skald BIhelps you share them through a controlled, branded and scalable portal experience.
Ready to share Power BI beyond your workspace?
If your team already uses Power BI but needs a better way to share reports with customers, partners or internal teams, Skald BI can help you turn existing reports into a secure branded reporting experience. Keep building in Power BI, keep control over access and give every audience a clearer way to use the insights you already create.
Book a demo with Skald BI and see how your existing Power BI reports can be published through a portal built for secure sharing at scale.
Table of contents
- Power BI in simple terms
- The main parts of Power BI
- Reports and dashboards
- Why companies choose Power BI
- Where Power BI starts to become harder
- Building reports is not the same as sharing reports
- Licensing, access and governance
- What is PowerBI Embedded?
- Where Skald BI fits
- When a Power BI portal makes sense
- A practical way to think about your Power BI setup
- So, what is Power BI?
- Ready to share Power BI beyond your workspace?

About the author
Mathias Melander
As Head of Product & Analytics at Skald BI, Mathias Melander leads the platform’s product strategy, technical architecture and analytics development. His focus is helping companies distribute Power BI reports securely through scalable, customer-facing BI portals.
Related articles

Power BI Portal: How to Share Reports Securely Beyond the Workspace
Learn what a Power BI portal is, when it is useful, and how to share Power BI reports securely with customers, partners and teams.
Read more
Power BI License: Costs, Sharing Rules, and Smarter Report Distribution
Understand Power BI license costs, sharing rules, external access, and how a secure portal can simplify report distribution.
Read more
What is Power BI? A practical guide for teams that need better reporting and better sharing
Learn what Power BI is, how it works and why sharing reports with customers, partners or teams often requires a better portal layer.
Read more