
Client Reporting Solution with Power BI: A Buyer’s Guide
⏲ Read time: 13 minutes

A client reporting solution manages how approved reports reach the right clients throughout the relationship; it does not replace the work of building and maintaining those reports in Power BI. For agencies, consultancies, service providers and B2B SaaS companies, the difficult part often begins after a useful report already exists: identifying users, granting appropriate access, separating client data, presenting current content, handling support and removing access when the relationship changes. This guide compares five delivery models for existing Power BI reports: static exports, native Power BI sharing or Apps, Microsoft Entra B2B guest access, a custom Power BI Embedded application and a ready-made reporting portal. The objective is not to select the most elaborate architecture. It is to find the simplest model that meets the audience, identity, security, experience and operating requirements. For a small, stable audience that already works comfortably in Microsoft, native Power BI sharing may be entirely sufficient.
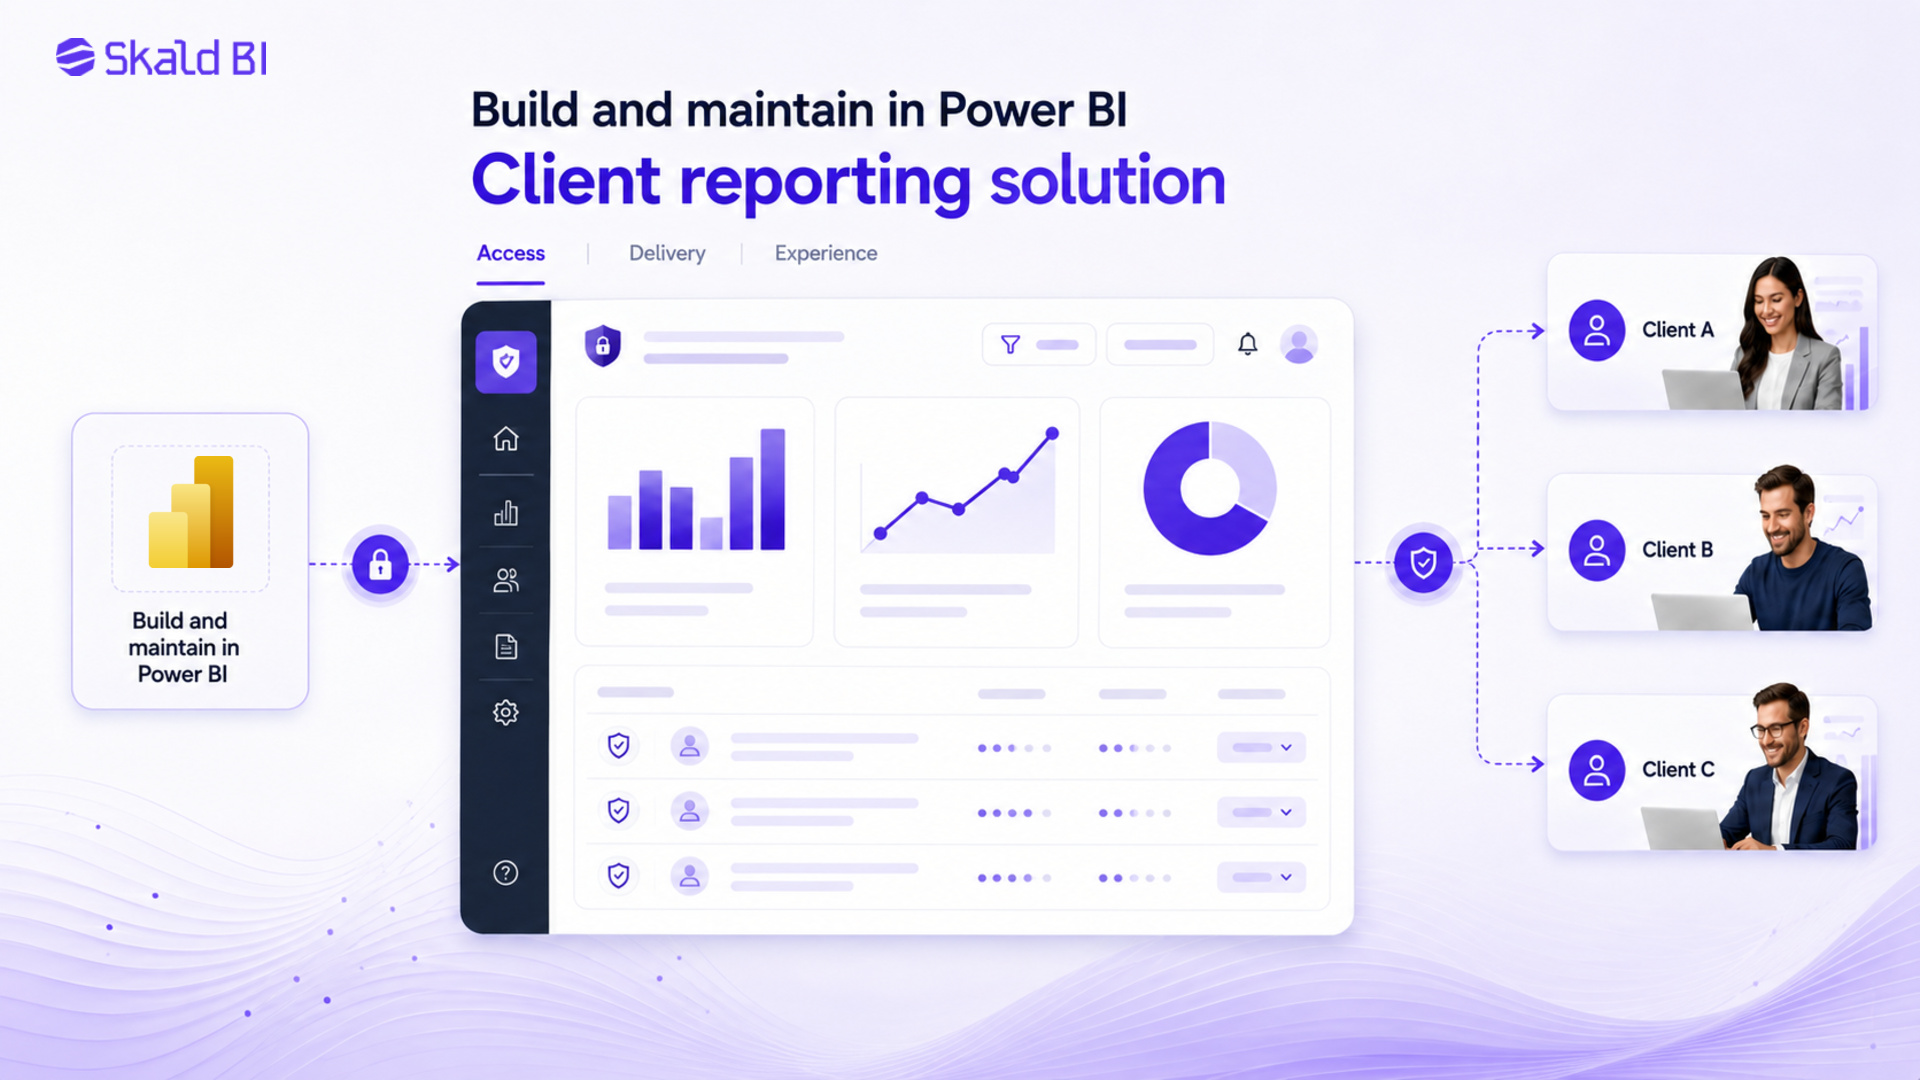
What is a client reporting solution?
A client reporting solution is the combination of technology, permissions and operating processes used to deliver approved reports and data experiences to clients over time. It can include static files, interactive Power BI content, an identity method, rules for report and data access, a place to find reports, and procedures for support and lifecycle changes. The definition is broader than a dashboard and narrower than the entire analytics stack.
A report is an asset; client reporting is a lifecycle
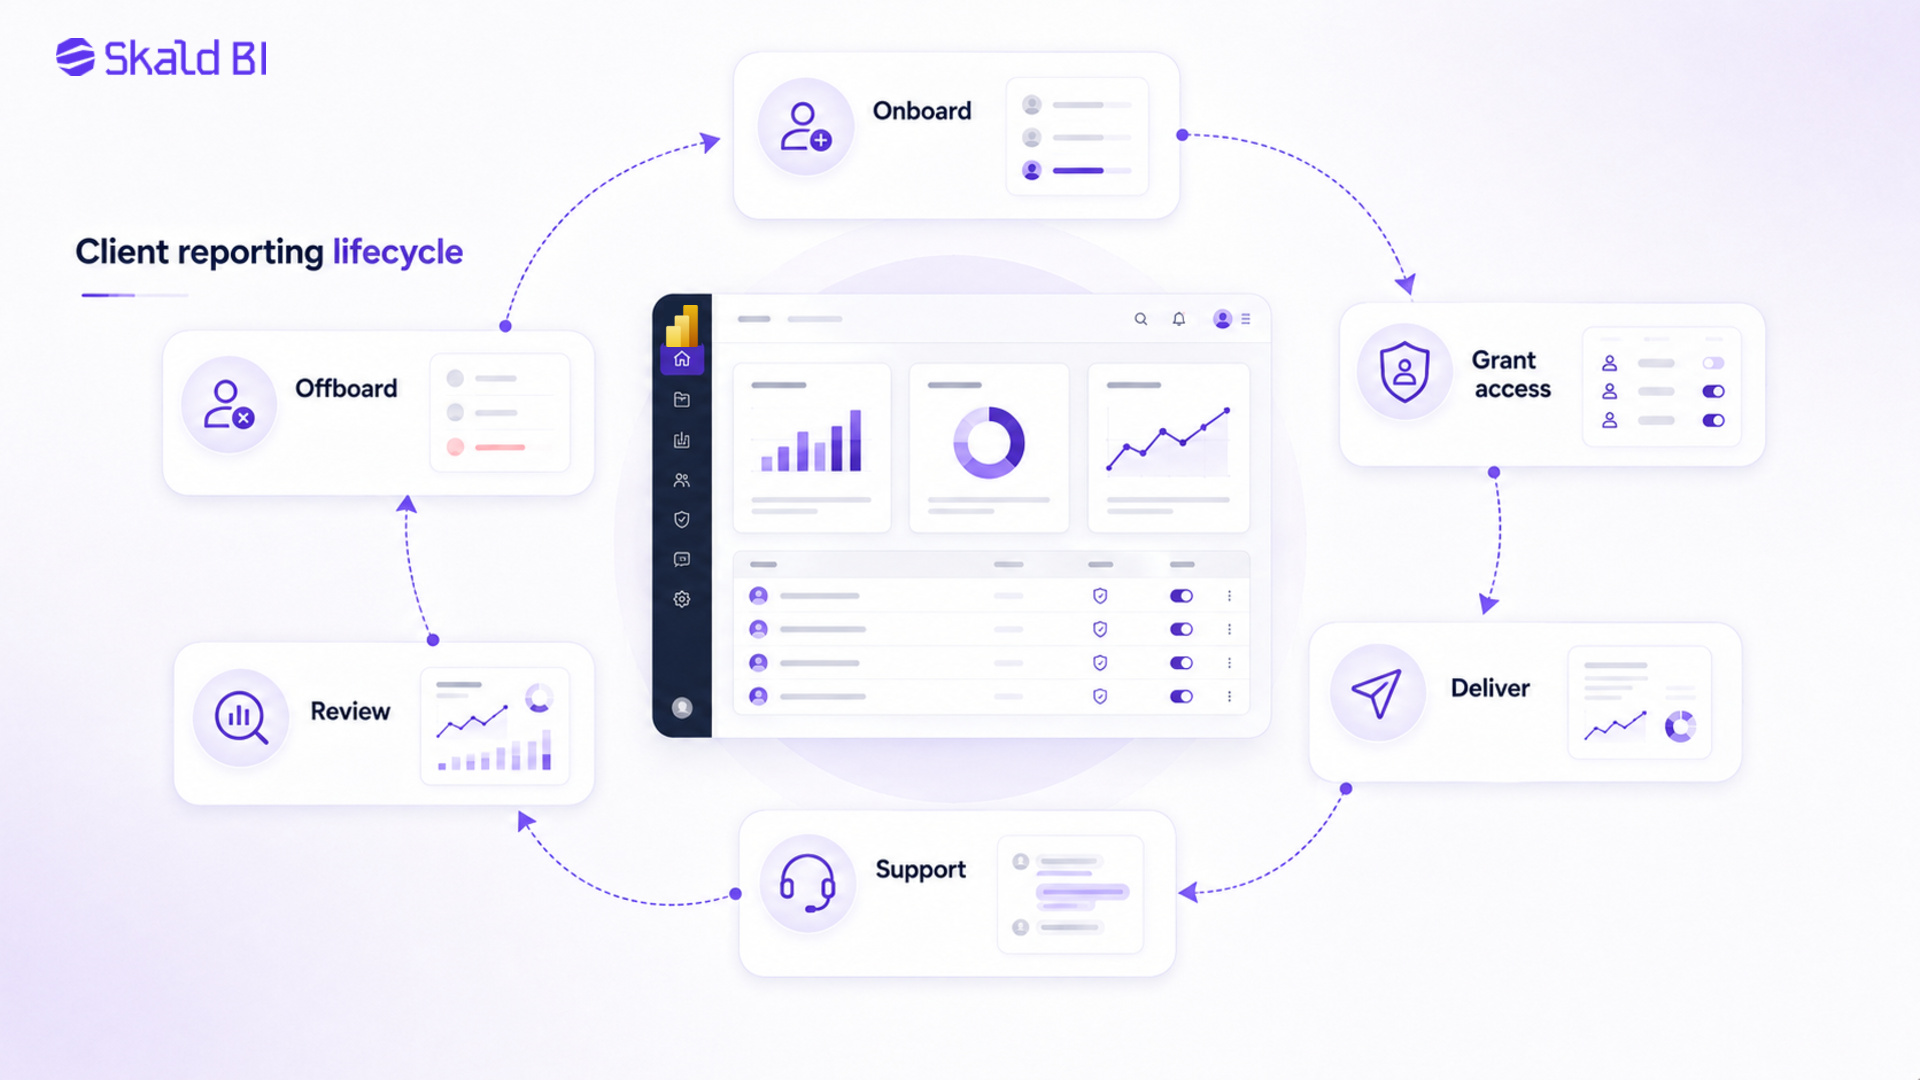
A Power BI report and its semantic model are analytical assets. Client reporting is the recurring service around those assets: decide which content is approved, onboard an organization, authenticate its users, grant report access, enforce data boundaries, make content discoverable, answer questions, review entitlements and offboard people or accounts. Both static and interactive delivery can be valid. A signed monthly PDF may suit an approval archive; an interactive report may suit recurring exploration.
Consider an illustrative consultancy with one reusable Power BI report serving 30 client organizations. The report design may remain consistent, but user identities, client-specific data, delivery dates, support contacts and access changes differ. The operating challenge is therefore not to create 30 dashboards. It is to run one controlled reporting lifecycle across 30 relationships. A dedicated Power BI portal is one possible delivery model, not the definition of client reporting itself.
| Lifecycle stage | Business question | Control needed | Typical owner |
|---|---|---|---|
| Onboard | Which client and users qualify? | Approval and identity record | Client operations |
| Grant access | Which reports and data? | Entitlement and data rule | BI and data owner |
| Deliver and navigate | Where is approved content? | Curated destination | Client delivery |
| Change roles | What changed? | Recorded access update | Account owner |
| Support and review | Does access remain appropriate? | Support route and review | Operations and IT |
| Offboard | What must be removed? | Revocation and confirmation | Identity owner |
Takeaway: The report is only one asset inside a recurring delivery process; the suggested owners above are an operating framework, not Microsoft-mandated roles.
Why client reporting breaks as the client portfolio grows
Client reporting usually breaks at the handoffs around the report—provisioning, access changes, delivery, support and offboarding—rather than in the Power BI report itself. Growth increases the number of relationships and exceptions faster than it increases the number of core report designs.
Manual delivery creates hidden operating work
Exports and email attachments can be rational for a small audience, an infrequent snapshot or a formal archive. Problems emerge when someone must repeatedly confirm filters, export the right version, rename the file, select recipients and answer which copy is current. The effort may sit across analysts, account teams and administrators, so no single budget line reveals it. The recommendation is not to automate every report. First determine whether delivery frequency, audience changes and error exposure justify a controlled channel.
Access and data separation become different control problems
Identity answers who the user is. Report permission answers which content that identity may open. Row-level or object-level controls answer which data within the semantic model the user may access. These decisions interact, but they are not interchangeable. Microsoft notes that sharing a report also grants access to its underlying semantic model and that hiding a page, visual, column or measure is not a security measure. Security therefore needs to be designed at the permission and model layers, then tested from the consumer’s real context. Use Power BI workspace permissions for collaboration deliberately, and treat row-level security in Power BI as one data-control layer rather than the full lifecycle model.
Reporting becomes part of the client experience
Clients judge whether they can find the latest approved content, understand where to ask for help and trust that the environment belongs to the service they purchased. Navigation and branding can reduce ambiguity and reinforce a consistent service experience. They cannot compensate for weak authentication, overbroad permissions or an untested data model. Commercial presentation and security governance must be evaluated separately.
Five models for delivering Power BI client reports
The main client reporting solutions are static exports, native Power BI sharing or Apps, Microsoft Entra B2B guest access, a custom Power BI Embedded application and a ready-made reporting portal. Each can be correct. The trade-off is how much interactivity, audience control, branding and application ownership the organization needs.
Static exports and scheduled files
PDF, Excel and presentation exports fit point-in-time records, approvals, board packs and recipients who do not need interactive analysis. They are familiar and easy to archive. Their weakness is lifecycle control: copies become stale, distribution can be manual, and a recalled attachment is hard to govern. Use them when immutability or simplicity matters more than live exploration, while applying secure file-delivery and retention rules appropriate to the data.
Native Power BI sharing and Power BI Apps
Native sharing is a strong starting point for named, governed audiences. Power BI Apps package approved content for consumption, while workspaces are collaboration and management surfaces. Microsoft’s current sharing guidance states that sharing and recipient requirements depend on Pro, Premium Per User and qualifying capacity arrangements; it also states that free-user access has capacity conditions. These rules can change, so validate the current tenant, capacity and contract rather than relying on a generic price calculation. For detailed implementation choices, see how to share Power BI reports with external users.
Microsoft Entra B2B guest access
Guest access can suit stable external groups that accept Microsoft identity and the host organization’s invitation process. Microsoft documents that external sharing must be enabled by an administrator and that recipients sign in through Microsoft Entra B2B. The practical fit depends on tenant settings, invitation and redemption flows, licensing, support and how guest identities are reviewed and removed. It is neither inherently insecure nor automatically convenient; test the complete journey with representative external users.
Custom Power BI Embedded application
Custom embedding fits when analytics must sit inside differentiated product workflows. Microsoft’s embed-for-your-customers pattern lets application users consume embedded content without signing in to Power BI or holding an individual Power BI license, but the application architecture still requires Power BI content, an Entra application and production capacity. The application owner must operate authentication, authorization, embedding logic, user mapping, capacity, monitoring, releases, incidents and support. This is a product commitment, not merely a different report link. Read more about what Power BI Embedded is before treating it as a distribution shortcut.
Ready-made client reporting portal
A ready-made portal is most relevant when existing reports need repeatable, client-facing distribution but a fully custom application is not differentiated enough to justify ownership. It may provide a more deliberate place for clients to find reports and can reduce the surrounding application work compared with building from scratch, within the product’s boundaries. Buyers still need evidence for authentication, authorization, report entitlements, data separation, capacity and licensing, branding, auditability, support and incident responsibilities. For the broader architecture comparison, see white label reporting with Power BI.
| Delivery model | Best fit | Client experience | Operating ownership | Main trade-off |
|---|---|---|---|---|
| Static exports/files | Snapshots and archives | Familiar, non-interactive | Delivery team | Version and distribution control |
| Native sharing/Power BI Apps | Known Microsoft audiences | Native Power BI | BI and tenant teams | Licensing and audience administration |
| Microsoft Entra B2B guest access | Stable external groups | Microsoft guest journey | Identity and BI teams | Invitation and tenant context |
| Custom Power BI Embedded application | Differentiated product workflows | Fully application-led | Product and engineering | Full application ownership |
| Ready-made reporting portal | Repeatable external distribution | Structured and branded | Buyer plus provider | Product limits and dependency |
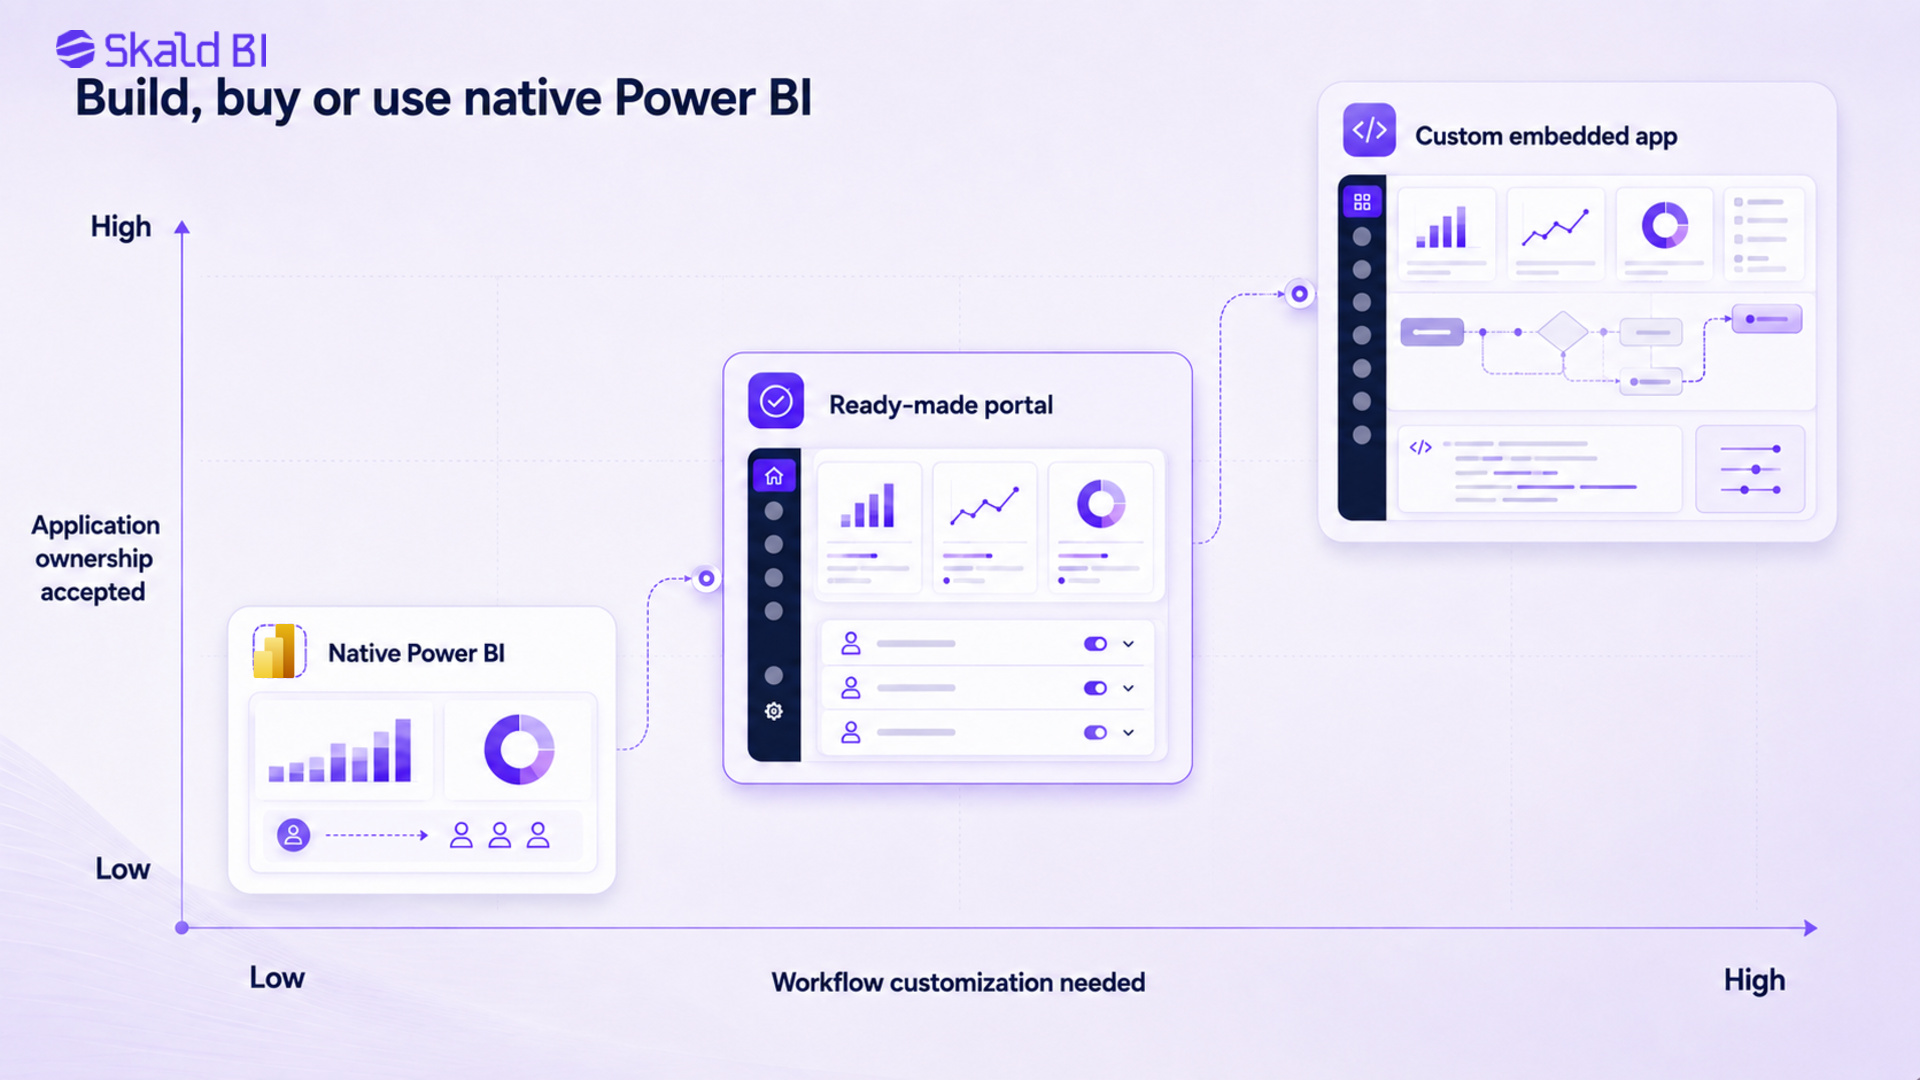
Takeaway: The more tailored the client experience, the more explicitly application and operating ownership must be assigned.
How to evaluate client reporting solutions
Evaluate the audience and service model first, then identity, report access, data separation, client experience and operating ownership. Feature comparison before requirement definition rewards long lists rather than a workable control model.
Audience and relationship
Count client organizations as well as users. Establish whether people are stable or change frequently, whether identities are internal, external or mixed, and whether reporting is an internal utility or a contracted deliverable. A small audience with predictable access may favor native sharing. Many client accounts with recurring onboarding and offboarding create a different administrative problem even when the total user count is modest.
Access and data controls
Document authentication, portal or report entitlement, and data-level security separately. Specify how a new user is approved, how role changes propagate, how access is reviewed and how it is removed. If RLS, OLS, separate semantic models or separate workspaces enforce client boundaries, test expected users, privileged users and unmapped users. Microsoft recommends validating RLS so unexpected effective identities return no rows. A successful administrator test is insufficient evidence of the client experience.
Experience and operations
Assess brand, domain, navigation, report discovery and support without treating them as security controls. Then assign responsibility for report lifecycle, identity, permissions, capacity, performance monitoring, audit evidence, incidents and vendor escalation. The useful output is a responsibility map across Microsoft, the buyer and any portal or application provider, supported by demonstrations, architecture documentation and contract terms.
| Requirement area | Decision question | Evidence to request | Failure to avoid |
|---|---|---|---|
| Audience and identity | Who signs in and how? | Journey and identity design | Unowned guest accounts |
| Report access | Who can open each report? | Entitlement demonstration | Workspace overexposure |
| Data separation | Which data can each identity query? | Model design and negative tests | Relying on hidden content |
| Client experience | Can users find approved content? | Representative user test | Design masking control gaps |
| Operations and support | Who owns each lifecycle event? | Responsibility and escalation map | Orphaned access and incidents |
| Cost and capacity | What scales with usage? | Contract and capacity model | Comparing unlike service scopes |
Takeaway: A feature list is insufficient; the buyer needs an evidence-backed responsibility and control model.
Build versus buy a client reporting portal
Build when the reporting experience is a differentiated product workflow; buy when the requirement is primarily controlled distribution of existing reports and the organization does not want to own another application stack. Use native Power BI when neither a custom application nor a separate portal is justified.
A SaaS product that combines analytics with transactions, approvals or operational actions may need custom embedding. Its product team can design identity, authorization, navigation and analytics as one workflow and place the application on a deliberate roadmap. The cost is continuing responsibility for security updates, capacity, monitoring, releases, support and incidents.
A consultancy delivering a standardized portfolio of existing reports usually has a different requirement: reliable client onboarding, clear report access, brand alignment and manageable administration. A ready-made portal may fit if its configuration and responsibility boundaries meet those needs. The organization accepts vendor dependency and product constraints in exchange for owning less application infrastructure.
A stable internal team may be best served by Power BI Apps, groups and native permissions. Adding a vendor would introduce another contract, integration and operating layer without solving a material problem. A hybrid can also be sensible—for example, native delivery for employees and a portal for clients—but only when separate audience needs justify the added model.
The decision should therefore compare workflow differentiation, engineering capability, identity ownership, operating maturity and exit costs. Do not label build or buy as universally faster, safer or cheaper. Require evidence for the chosen architecture and assign who maintains it after launch.
Calculate total cost, not only viewer licensing
Compare each option over the same period and service level, including Microsoft licensing or capacity, implementation, engineering, administration, support, governance and opportunity cost. A public license price multiplied by viewer count is not a complete TCO model.
Separate creator and publisher needs from viewer and capacity design. Then include the distribution platform, identity and security implementation, integrations, application development where relevant, monitoring, upgrades, user administration and client support. Measure work displaced from analytics and engineering teams rather than assuming their time is free. Review current contracts, region, currency and Microsoft terms; the current Microsoft sharing guidance shows why capacity and license conditions must be evaluated in the actual architecture. The Skald BI guide to Power BI license types and cost provides additional context without replacing contract validation.
Decision framework: Client reporting TCO = Microsoft licensing and capacity + distribution platform + implementation + ongoing engineering and operations + user administration and support + governance and risk work + opportunity cost.
| Cost area | What to include | Measurement question | Source of evidence |
|---|---|---|---|
| Microsoft creators and publishers | Required authoring licenses | Who builds and publishes? | Tenant and contract |
| Viewers and capacity | Audience and workload design | What usage must capacity serve? | Architecture and current terms |
| Distribution platform | Portal or application fees | What scales by user or usage? | Supplier proposal |
| Implementation | Identity, security and integration | What must be configured? | Scoped plan |
| Engineering and maintenance | Code, releases and monitoring | Who maintains production? | Roadmap and staffing |
| Administration and support | Users, access and incidents | What recurring work remains? | Process observation |
| Governance and risk | Reviews, testing and evidence | Which controls need proof? | Control register |
| Opportunity cost | Displaced product and BI work | What work is deferred? | Prioritized backlog |
Takeaway: The lowest visible license cost can still produce the highest operating cost if delivery work has no scalable owner.
When native Power BI sharing is enough
Native sharing is often enough when users are known, stable, correctly licensed or capacity-covered, comfortable with Microsoft access and easy to administer through existing controls. It is particularly credible when the audience is internal or a small external group, security groups are well maintained, report ownership is clear and Power BI Apps or direct sharing provide an acceptable consumption experience.
The decision should be based on observed effort and risk, not a general belief that portals are more professional. If onboarding is infrequent, offboarding is controlled, branding is secondary and support demand is low, the native model may be the simpler and more economical choice. Microsoft’s report-consumer security guidance recommends Power BI Apps for many read-only consumer scenarios because permissions can be managed across a set of items rather than one item at a time.
A portal added too early creates subscription cost, vendor dependency, configuration work and another incident path. It also cannot repair unclear report ownership or an unsafe semantic model. Strengthen governance first; introduce a separate distribution layer only when a defined audience, experience or operating requirement warrants it.
Where Skald BI fits in the client reporting model
Skald BI is relevant when existing Power BI reports need a structured, secure and branded distribution layer for clients, partners or broader audiences. Reports and semantic models remain created, published and maintained in Power BI. Skald BI addresses the surrounding distribution problem: access, rights, presentation, cost control and administration.
The strongest fit is recurring reporting across multiple client organizations where approved reports already work but the delivery lifecycle has become a service-design problem. This includes Power BI client delivery for consultants and agencies and reporting for service providers and partners. The weakest fit is a small internal team already well served by native sharing, or an organization whose report ownership and data controls are not ready for external use.
Before selecting Skald BI, confirm its current authentication, access hierarchy, data-security integration, Microsoft capacity and licensing architecture, branding, audit, support and administration capabilities against the proposed use case. Product fit should be proven with a representative audience and report. The feature overview explains how organizations can share existing Power BI reports through Skald BI, but implementation-specific claims still require confirmation.
Implementation checklist for an end-to-end client reporting process
Start with one representative report and client audience, map the complete lifecycle, validate access and data separation, then pilot the operating model before scaling. A pilot should expose real identity, permission and support conditions—not only prove that an administrator can open a report.
- Inventory proposed reports. Separate approved client content from drafts and internal working assets.
- Name accountable owners. Assign business, data and technical ownership for every report.
- Map audiences and lifecycle events. Record organizations, users, roles, joiners, changes and leavers.
- Choose authentication. Define how each audience proves identity and who operates that method.
- Separate report and data access. State which content users may open and which data they may query.
- Validate data separation. Test RLS, OLS or alternative controls using expected, privileged and unmapped identities.
- Define the client experience. Specify branding, navigation, domain, accessibility and support requirements.
- Compare equivalent scopes. Evaluate delivery options over the same service level and TCO horizon.
- Assign recurring ownership. Cover onboarding, changes, offboarding, incidents and access reviews.
- Pilot with a representative client. Use a real report, realistic identity and normal device context.
- Test removal and failure. Confirm revoked access, missing mappings, capacity issues and escalation routes.
- Measure the operating model. Track administration, support, usage and client experience without inventing benchmarks.
The output should be a tested responsibility model, not only a technical connection. Record exceptions, confirm who resolves them and decide whether they are pilot defects, configuration limits or accepted process steps. Scale only after access removal and negative security cases work as deliberately as normal access.

Choose the simplest controlled delivery model
The best client reporting solution is the simplest model that meets the audience, identity, data-security, experience and operating requirements. Power BI should remain the report and semantic-model platform when those assets already meet the analytical need; client delivery is a separate design decision. Static files, native sharing, guest access, custom embedding and ready-made portals each have valid use cases. Skald BI is relevant when recurring reporting across multiple audiences requires a structured, branded distribution layer without rebuilding the reports or owning a fully custom application. It is not automatically justified for small, stable audiences. Evaluate one representative report, one real client identity and the complete lifecycle—including access removal—before selecting the wider model.
Table of contents
- What is a client reporting solution?
- A report is an asset; client reporting is a lifecycle
- Why client reporting breaks as the client portfolio grows
- Manual delivery creates hidden operating work
- Access and data separation become different control problems
- Reporting becomes part of the client experience
- Five models for delivering Power BI client reports
- Static exports and scheduled files
- Native Power BI sharing and Power BI Apps
- Microsoft Entra B2B guest access
- Custom Power BI Embedded application
- Ready-made client reporting portal
- How to evaluate client reporting solutions
- Audience and relationship
- Access and data controls
- Experience and operations
- Build versus buy a client reporting portal
- Calculate total cost, not only viewer licensing
- When native Power BI sharing is enough
- Where Skald BI fits in the client reporting model
- Implementation checklist for an end-to-end client reporting process

About the author
Mathias Melander
As Head of Product & Analytics at Skald BI, Mathias Melander leads the platform’s product strategy, technical architecture and analytics development. His focus is helping companies distribute Power BI reports securely through scalable, customer-facing BI portals.
Related articles

Power BI sharing: how to share reports securely with the right users
Learn how Power BI sharing works across reports, dashboards, workspaces, external users, licenses, RLS and secure branded portals.
Read more
How to Share Power BI Report with External Users Securely
Learn how to share Power BI reports with external users, customers and partners securely, and when a branded portal makes sense.
Read more
Power BI White Label Usecases: 8 Practical Examples for Customer and Partner Reporting
Explore 8 practical Power BI white label usecases and learn when a branded reporting portal makes sense for customers and partners.
Read more